Toyota 2012 Annual Report Download - page 116
Download and view the complete annual report
Please find page 116 of the 2012 Toyota annual report below. You can navigate through the pages in the report by either clicking on the pages listed below, or by using the keyword search tool below to find specific information within the annual report.-
 1
1 -
2
-
3
-
4
-
5
-
6
-
7
-
8
-
9
-
10
-
11
-
12
-
13
-
14
-
15
-
16
-
17
-
18
-
19
-
20
-
21
-
22
-
23
-
24
-
25
-
26
-
27
-
28
-
29
-
30
-
31
-
32
-
33
-
34
-
35
-
36
-
37
-
38
-
39
-
40
-
41
-
42
-
43
-
44
-
45
-
46
-
47
-
48
-
49
-
50
-
51
-
52
-
53
-
54
-
55
-
56
-
57
-
58
-
59
-
60
-
61
-
62
-
63
-
64
-
65
-
66
-
67
-
68
-
69
-
70
-
71
-
72
-
73
-
74
-
75
-
76
-
77
-
78
-
79
-
80
-
81
-
82
-
83
-
84
-
85
-
86
-
87
-
88
-
89
-
90
-
91
-
92
-
93
-
94
-
95
-
96
-
97
-
98
-
99
-
100
-
101
-
102
-
103
-
104
-
105
-
 106
106 -
 107
107 -
 108
108 -
 109
109 -
 110
110 -
 111
111 -
 112
112 -
 113
113 -
 114
114 -
 115
115 -
 116
116 -
 117
117 -
 118
118 -
 119
119 -
 120
120 -
 121
121 -
 122
122 -
 123
123 -
 124
124 -
 125
125 -
 126
126 -
127
 |
 |
TOYOTA ANNUAL REPORT 2012
Toyota Global Vision Changes for Making
Ever-Better Cars President
ʼ
s Message Medium- to Long-Term
Growth Initiatives Special Feature Management and
Corporate Information Investor Information
Business and
Performance Review Financial Section
Notes to Consolidated Financial Statements
management believes approximate arm
ʼ
s-length
transactions. In measuring the reportable
segments
ʼ
income or losses, operating income
consists of revenue less operating expenses.
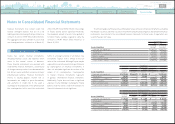
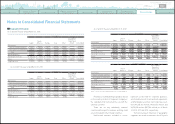
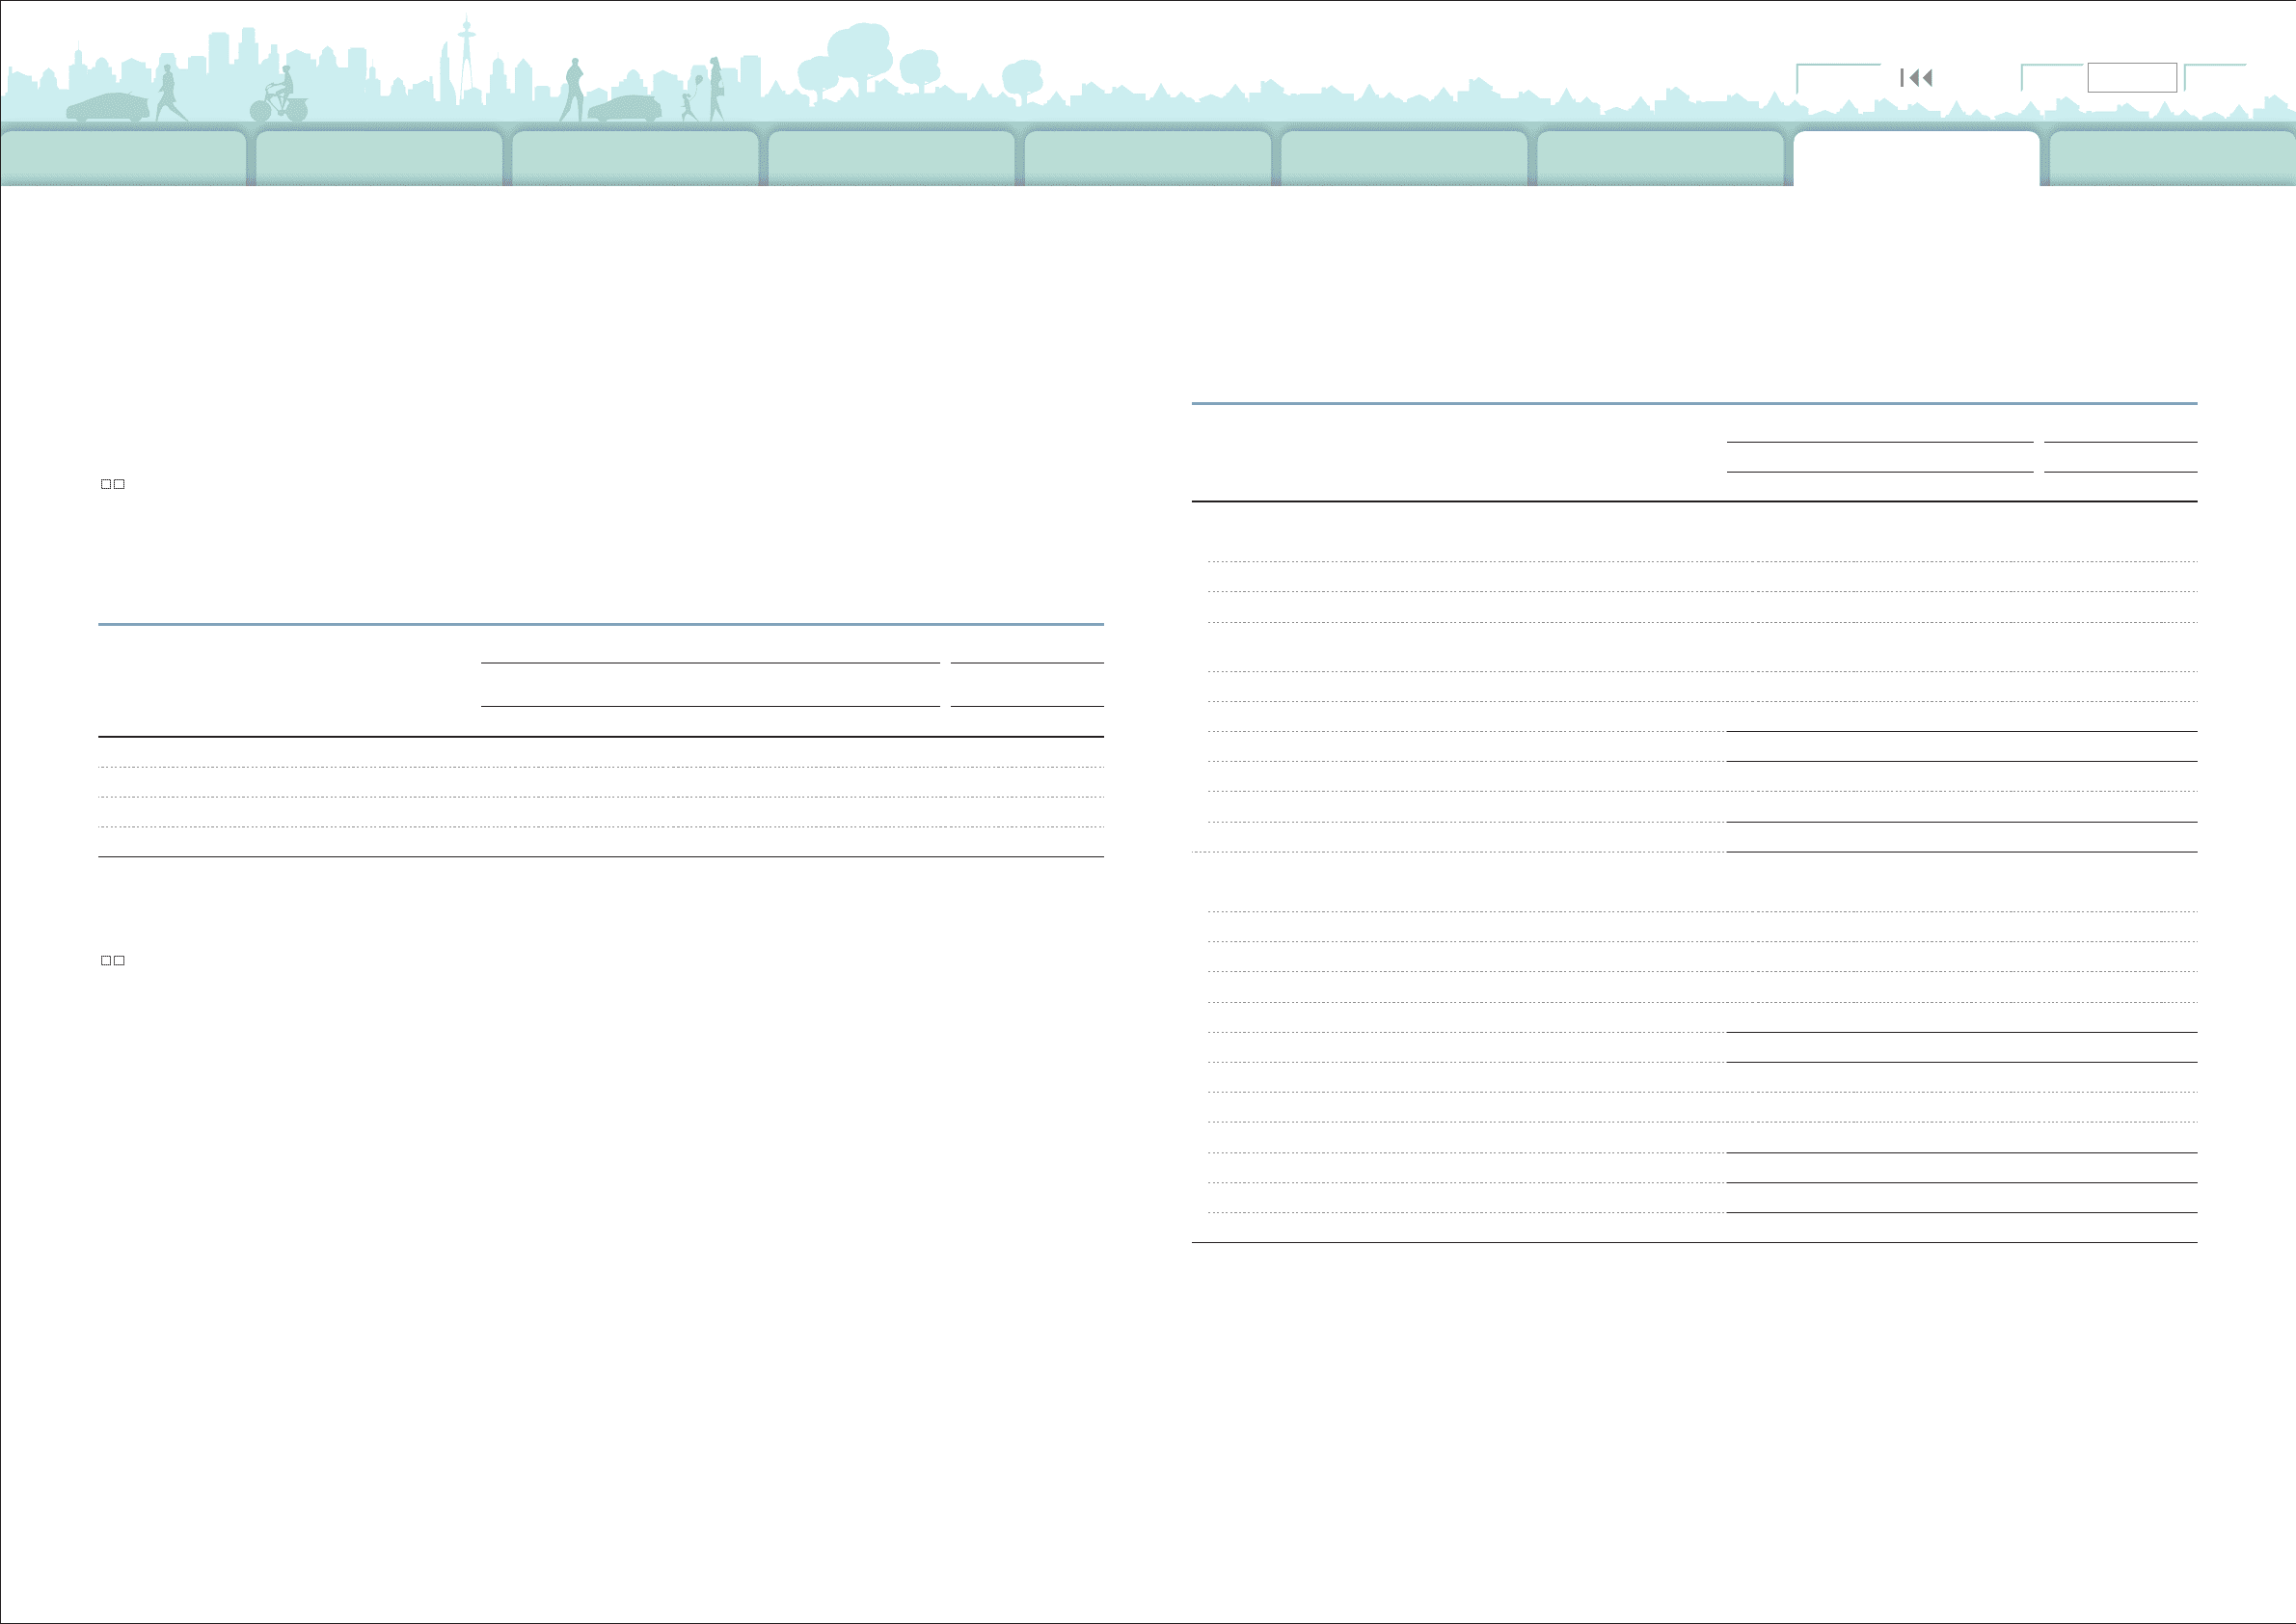
The following information shows revenues that are attributed to countries based on location of
customers, excluding customers in Japan. In addition to the disclosure requirements under U.S.GAAP,
Toyota discloses this information in order to provide financial statement users with valuable information.
Assets in the non-financial services include unallocated corporate assets.
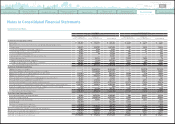
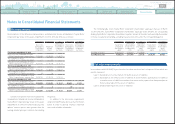
■
Overseas Revenues by destination
Balance sheets
Yen in millions
U.S. dollars in millions
For the years ended March 31, For the year ended
March 31,
2010 2011 2012 2012
North America ¥5,718,381 ¥5,398,278 ¥ 4,715,804 $ 57,377
Europe 2,023,280 1,793,932 1,817,944 22,119
Asia 2,641,471 3,280,384 3,284,392 39,961
Other 2,838,671 3,196,114 3,103,383 37,759
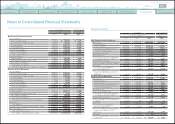
The financial data below presents separately Toyota
ʼ
s non-financial services and financial services
businesses.
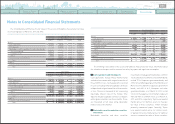
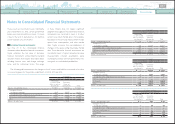
■
Certain financial statement data on non-financial services and financial services businesses
“
Other
”
consists of Central and South America, Oceania, Africa and the Middle East, etc.
Yen in millions
U.S. dollars in millions
March 31, March 31,
2011 2012 2012
Non-Financial Services Businesses
Current assets
Cash and cash equivalents ¥ 1,300,553 ¥ 1,104,636 $ 13,440
Marketable securities 1,036,555 1,015,626 12,357
Trade accounts and notes receivable, less allowance
for doubtful accounts 1,483,551 2,031,472 24,717
Inventories 1,304,128 1,622,154 19,737
Prepaid expenses and other current assets 1,383,616 1,464,124 17,814
Total current assets 6,508,403 7,238,012 88,065
Investments and other assets 5,825,966 6,218,377 75,659
Property, plant and equipment 4,608,309 4,510,716 54,881
Total Non-Financial Services Businesses assets 16,942,678 17,967,105 218,605
Financial Services Businesses
Current assets
Cash and cash equivalents 780,156 574,564 6,991
Marketable securities 188,880 165,444 2,013
Finance receivables, net 4,136,805 4,114,897 50,065
Prepaid expenses and other current assets 636,249 685,611 8,342
Total current assets 5,742,090 5,540,516 67,411
Noncurrent finance receivables, net 5,556,746 5,602,462 68,165
Investments and other assets 365,707 304,906 3,709
Property, plant and equipment 1,700,851 1,724,664 20,984
Total Financial Services Businesses assets 13,365,394 13,172,548 160,269
Eliminations
(
489,906
)(
488,688
) (
5,946
)
Total assets ¥29,818,166 ¥ 30,650,965 $ 372,928
0820
Search NextPrev page 116
Contents