Toyota 2012 Annual Report Download - page 57
Download and view the complete annual report
Please find page 57 of the 2012 Toyota annual report below. You can navigate through the pages in the report by either clicking on the pages listed below, or by using the keyword search tool below to find specific information within the annual report.-
 1
1 -
2
-
3
-
4
-
5
-
6
-
7
-
8
-
9
-
10
-
11
-
12
-
13
-
14
-
15
-
16
-
17
-
18
-
19
-
20
-
21
-
22
-
23
-
24
-
25
-
26
-
27
-
28
-
29
-
30
-
31
-
32
-
33
-
34
-
35
-
36
-
37
-
38
-
39
-
40
-
41
-
42
-
43
-
44
-
45
-
46
-
 47
47 -
 48
48 -
 49
49 -
 50
50 -
 51
51 -
 52
52 -
 53
53 -
 54
54 -
 55
55 -
 56
56 -
 57
57 -
 58
58 -
 59
59 -
 60
60 -
 61
61 -
 62
62 -
 63
63 -
 64
64 -
 65
65 -
 66
66 -
 67
67 -
68
-
69
-
70
-
71
-
72
-
73
-
74
-
75
-
76
-
77
-
78
-
79
-
80
-
81
-
82
-
83
-
84
-
85
-
86
-
87
-
88
-
89
-
90
-
91
-
92
-
93
-
94
-
95
-
96
-
97
-
98
-
99
-
100
-
101
-
102
-
103
-
104
-
105
-
106
-
107
-
108
-
109
-
110
-
111
-
112
-
113
-
114
-
115
-
116
-
117
-
118
-
119
-
120
-
121
-
122
-
123
-
124
-
125
-
126
-
127
 |
 |
TOYOTA ANNUAL REPORT 2012
Toyota Global Vision Changes for Making
Ever-Better Cars President
ʼ
s Message Medium- to Long-Term
Growth Initiatives Special Feature Management and
Corporate Information Investor Information
Business and
Performance Review Financial Section
Management's Discussion and Analysis of Financial Condition and Results of Operations
improvement in earnings by more than offsetting
the effects from raw materials price increase.
These cost reduction efforts related to ongoing
value engineering and value analysis activities,
the use of common parts resulting in a reduction
of part types and other manufacturing initiatives
designed to reduce the costs of vehicle production.
Cost of products sold decreased by ¥189.8 billion,
or 1.2%, to ¥15,795.9 billion during fiscal 2012
compared with the prior fiscal year. The decrease
resulted from the ¥343.6 billion favorable impact
of fluctuations in foreign currency translation
rates and others, and the ¥150.0 billion impact
of cost reduction efforts, partially offset by the
¥135.0 billion impact of changes in vehicle unit
sales and sales mix and other operational factors,
and ¥110.0 billion increase in miscellaneous
costs and others. The increase in miscellaneous
costs was due mainly to the ¥50.0 billion increase
in research and development expenses and the
¥80.0 billion increase in labor costs.
In September 2011, Toyota announced in Japan
the service campaign of certain models of Toyota
in relation to abnormal noise and oil leakage that
may have resulted from slack of bolts in the sub
transmission and the rear wheel differential.
The affected vehicle models included EstimaL,
EstimaT and Wish, 181 thousand vehicles were
included in this service campaign.
In November 2011, Toyota announced in Japan
and other regions the voluntary safety recall of
certain models of Toyota and Lexus brands
ʼ
vehicles in relation to abnormal noise, charge
warning light indicators, and increasing of handle
operation force resulted from peeling of a bonded
part of the engine crankshaft pulley. The affected
vehicle models included AlphardG, AlphardV,
EstimaL, EstimaT, KlugerV, KlugerL, Kluger
Hybrid, Harrier, Harrier Hybrid, Windom, RX300,
RX330, RX400h, ES300, ES330, Solara, Camry,
Avalon, Sienna, Highlander, and Highlander Hybrid,
549 thousand vehicles were included in this recall.
During fiscal 2012, Toyota
ʼ
s continued cost
reduction efforts reduced operating costs and
expenses by ¥150.0 billion. The amount of effect
of cost reduction efforts includes the impact of
fluctuation in the price of steel, precious metals,
non-ferrous alloys including aluminum, plastic
parts and other production materials and parts.
In fiscal 2012, raw materials prices were on an
increasing trend; however, continued cost reduction
efforts together with suppliers contributed to the
Cost of financing operations decreased by ¥36.8
billion, or 5.9%, to ¥592.6 billion during fiscal 2012
compared with the prior fiscal year. The decrease
resulted from the ¥35.7 billion favorable impact
of fluctuations in foreign currency translation
rates and others, partially offset by the ¥20.8
billion recording of valuation losses on interest
rate swaps stated at fair value.
Selling, general and administrative expenses
decreased by ¥70.6 billion, or 3.7%, to ¥1,839.4
billion during fiscal 2012 compared with the
prior fiscal year. This decrease reflects the ¥53.0
billion favorable impact of fluctuations in foreign
currency translation rates and others, and the
¥19.2 billion decrease for the financial services
operations.
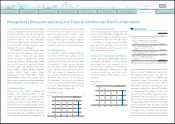
Toyota
ʼ
s operating income decreased by ¥112.6
billion, or 24.1%, to ¥355.6 billion during fiscal
2012 compared with the prior fiscal year. This
decrease was due mainly to the ¥285.4 billion
unfavorable impact of fluctuations in foreign
currency translation rates and others, and the
¥100.0 billion increase in miscellaneous costs
and others, partially offset by the ¥170.0 billion
of favorable impact by changes in vehicle unit
sales and sales mix and other operational factors
and the ¥102.7 billion increase of cost reduction
efforts, financial services operations, and others.
The unfavorable impact of fluctuations in foreign
currency translation rates and others included
¥250.0 billion unfavorable impact of fluctuations
in foreign currency transaction rates. The ¥102.7
billion increase of cost reduction efforts, financial
services operations, and others reflects the ¥150.0
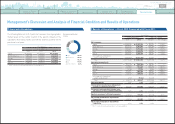
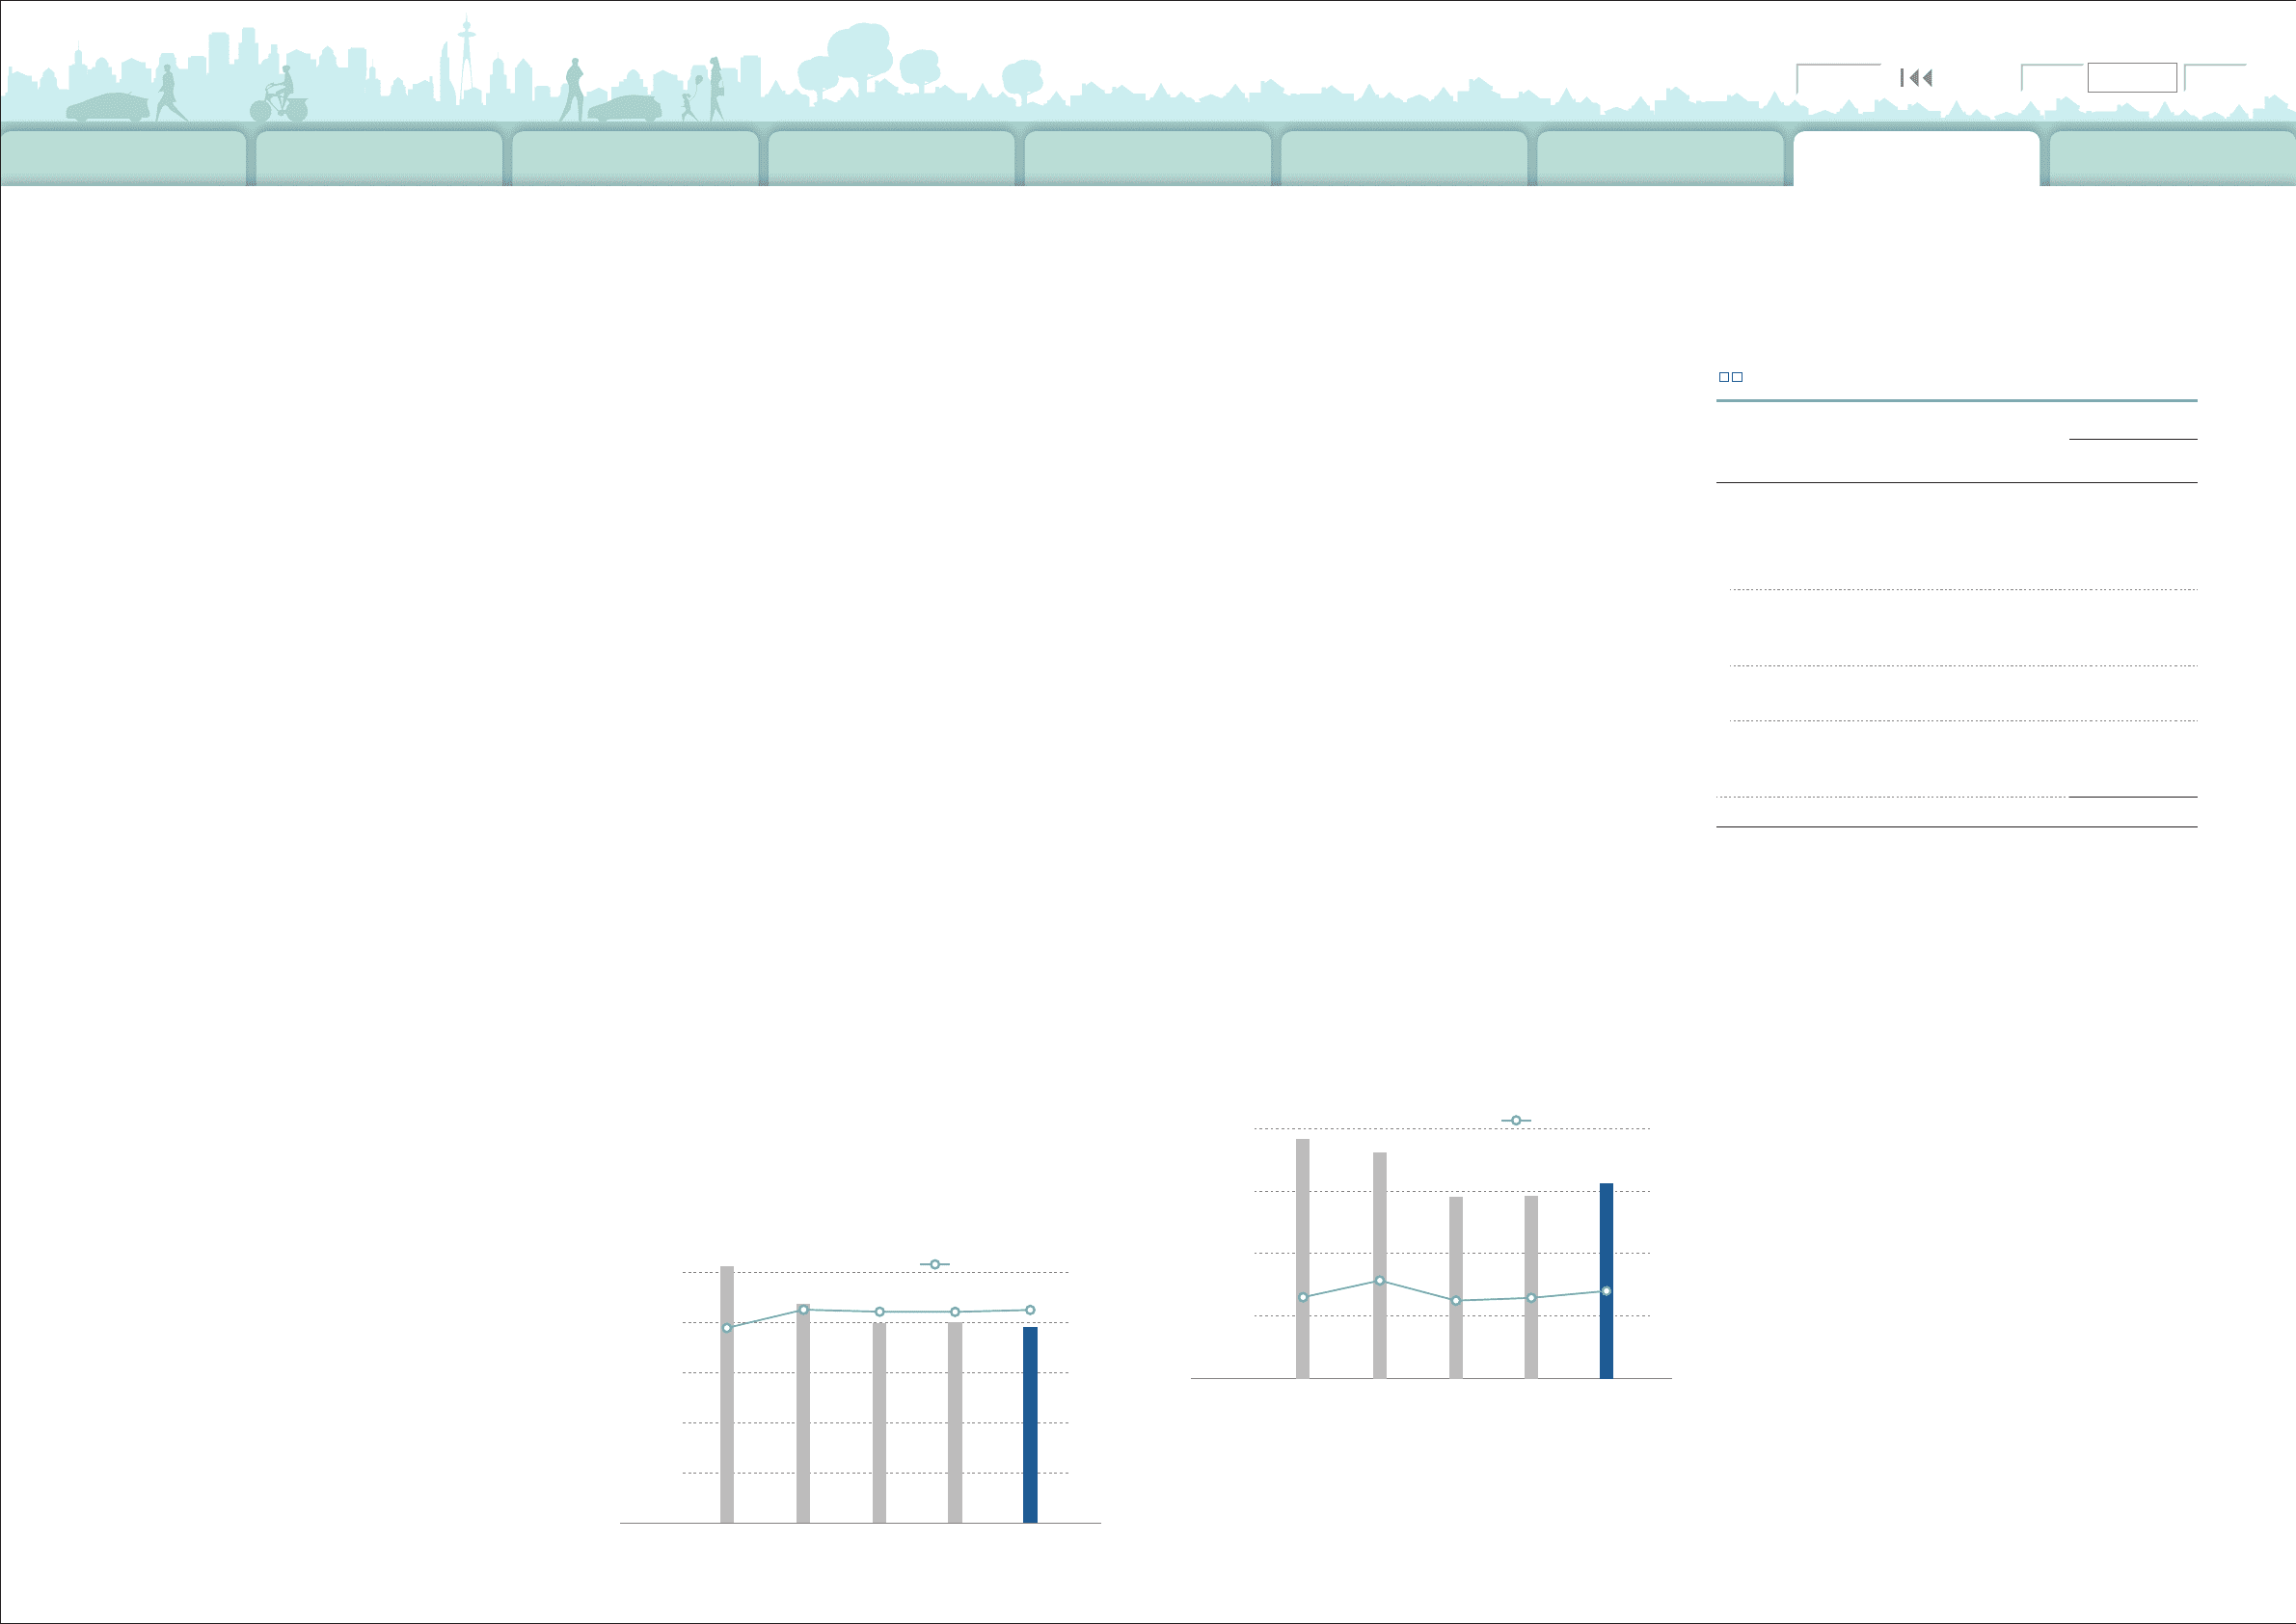
Cost Reduction Efforts
Cost of Products Sold
Cost of Financing Operations
Selling, General and Administrative Expenses
0
(¥ Billion)
2 5 0
500
7 5 0
1,000
0
12
9
6
3
(%)
% of net revenues
(Right scale)
‘12‘09 ‘10
‘08
‘11
0
(¥ Billion) (%)
% of net revenues
(Right scale)
4,000
8,000
12,000
16,000
20,000
0
100
80
60
40
20
‘12‘09 ‘10
‘08
‘11
Cost of Products Sold
R&D Expenses
■
Operating Income
Yen in millions
2012 vs. 2011
Change
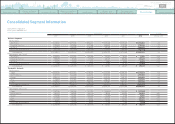
Changes in operating income and loss:
Effect of changes in vehicle unit sales
and sales mix and other operational
factors ¥ 170,000
Effect of fluctuation in foreign
currency translation rates and
others
(
285,400
)
Effect of increase in miscellaneous
costs and others
(
100,000
)
Effect of cost reduction efforts,
financial services operations, and
others 102,748
Total ¥
(
112,652
)
0820
Search NextPrev page 57
Contents