Toyota 2012 Annual Report Download - page 97
Download and view the complete annual report
Please find page 97 of the 2012 Toyota annual report below. You can navigate through the pages in the report by either clicking on the pages listed below, or by using the keyword search tool below to find specific information within the annual report.-
 1
1 -
2
-
3
-
4
-
5
-
6
-
7
-
8
-
9
-
10
-
11
-
12
-
13
-
14
-
15
-
16
-
17
-
18
-
19
-
20
-
21
-
22
-
23
-
24
-
25
-
26
-
27
-
28
-
29
-
30
-
31
-
32
-
33
-
34
-
35
-
36
-
37
-
38
-
39
-
40
-
41
-
42
-
43
-
44
-
45
-
46
-
47
-
48
-
49
-
50
-
51
-
52
-
53
-
54
-
55
-
56
-
57
-
58
-
59
-
60
-
61
-
62
-
63
-
64
-
65
-
66
-
67
-
68
-
69
-
70
-
71
-
72
-
73
-
74
-
75
-
76
-
77
-
78
-
79
-
80
-
81
-
82
-
83
-
84
-
85
-
86
-
 87
87 -
 88
88 -
 89
89 -
 90
90 -
 91
91 -
 92
92 -
 93
93 -
 94
94 -
 95
95 -
 96
96 -
 97
97 -
 98
98 -
 99
99 -
 100
100 -
 101
101 -
 102
102 -
 103
103 -
 104
104 -
 105
105 -
 106
106 -
 107
107 -
108
-
109
-
110
-
111
-
112
-
113
-
114
-
115
-
116
-
117
-
118
-
119
-
120
-
121
-
122
-
123
-
124
-
125
-
126
-
127
 |
 |
TOYOTA ANNUAL REPORT 2012
Toyota Global Vision Changes for Making
Ever-Better Cars President
ʼ
s Message Medium- to Long-Term
Growth Initiatives Special Feature Management and
Corporate Information Investor Information
Business and
Performance Review Financial Section
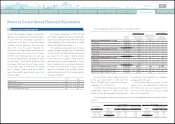
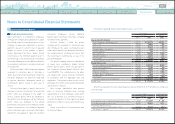
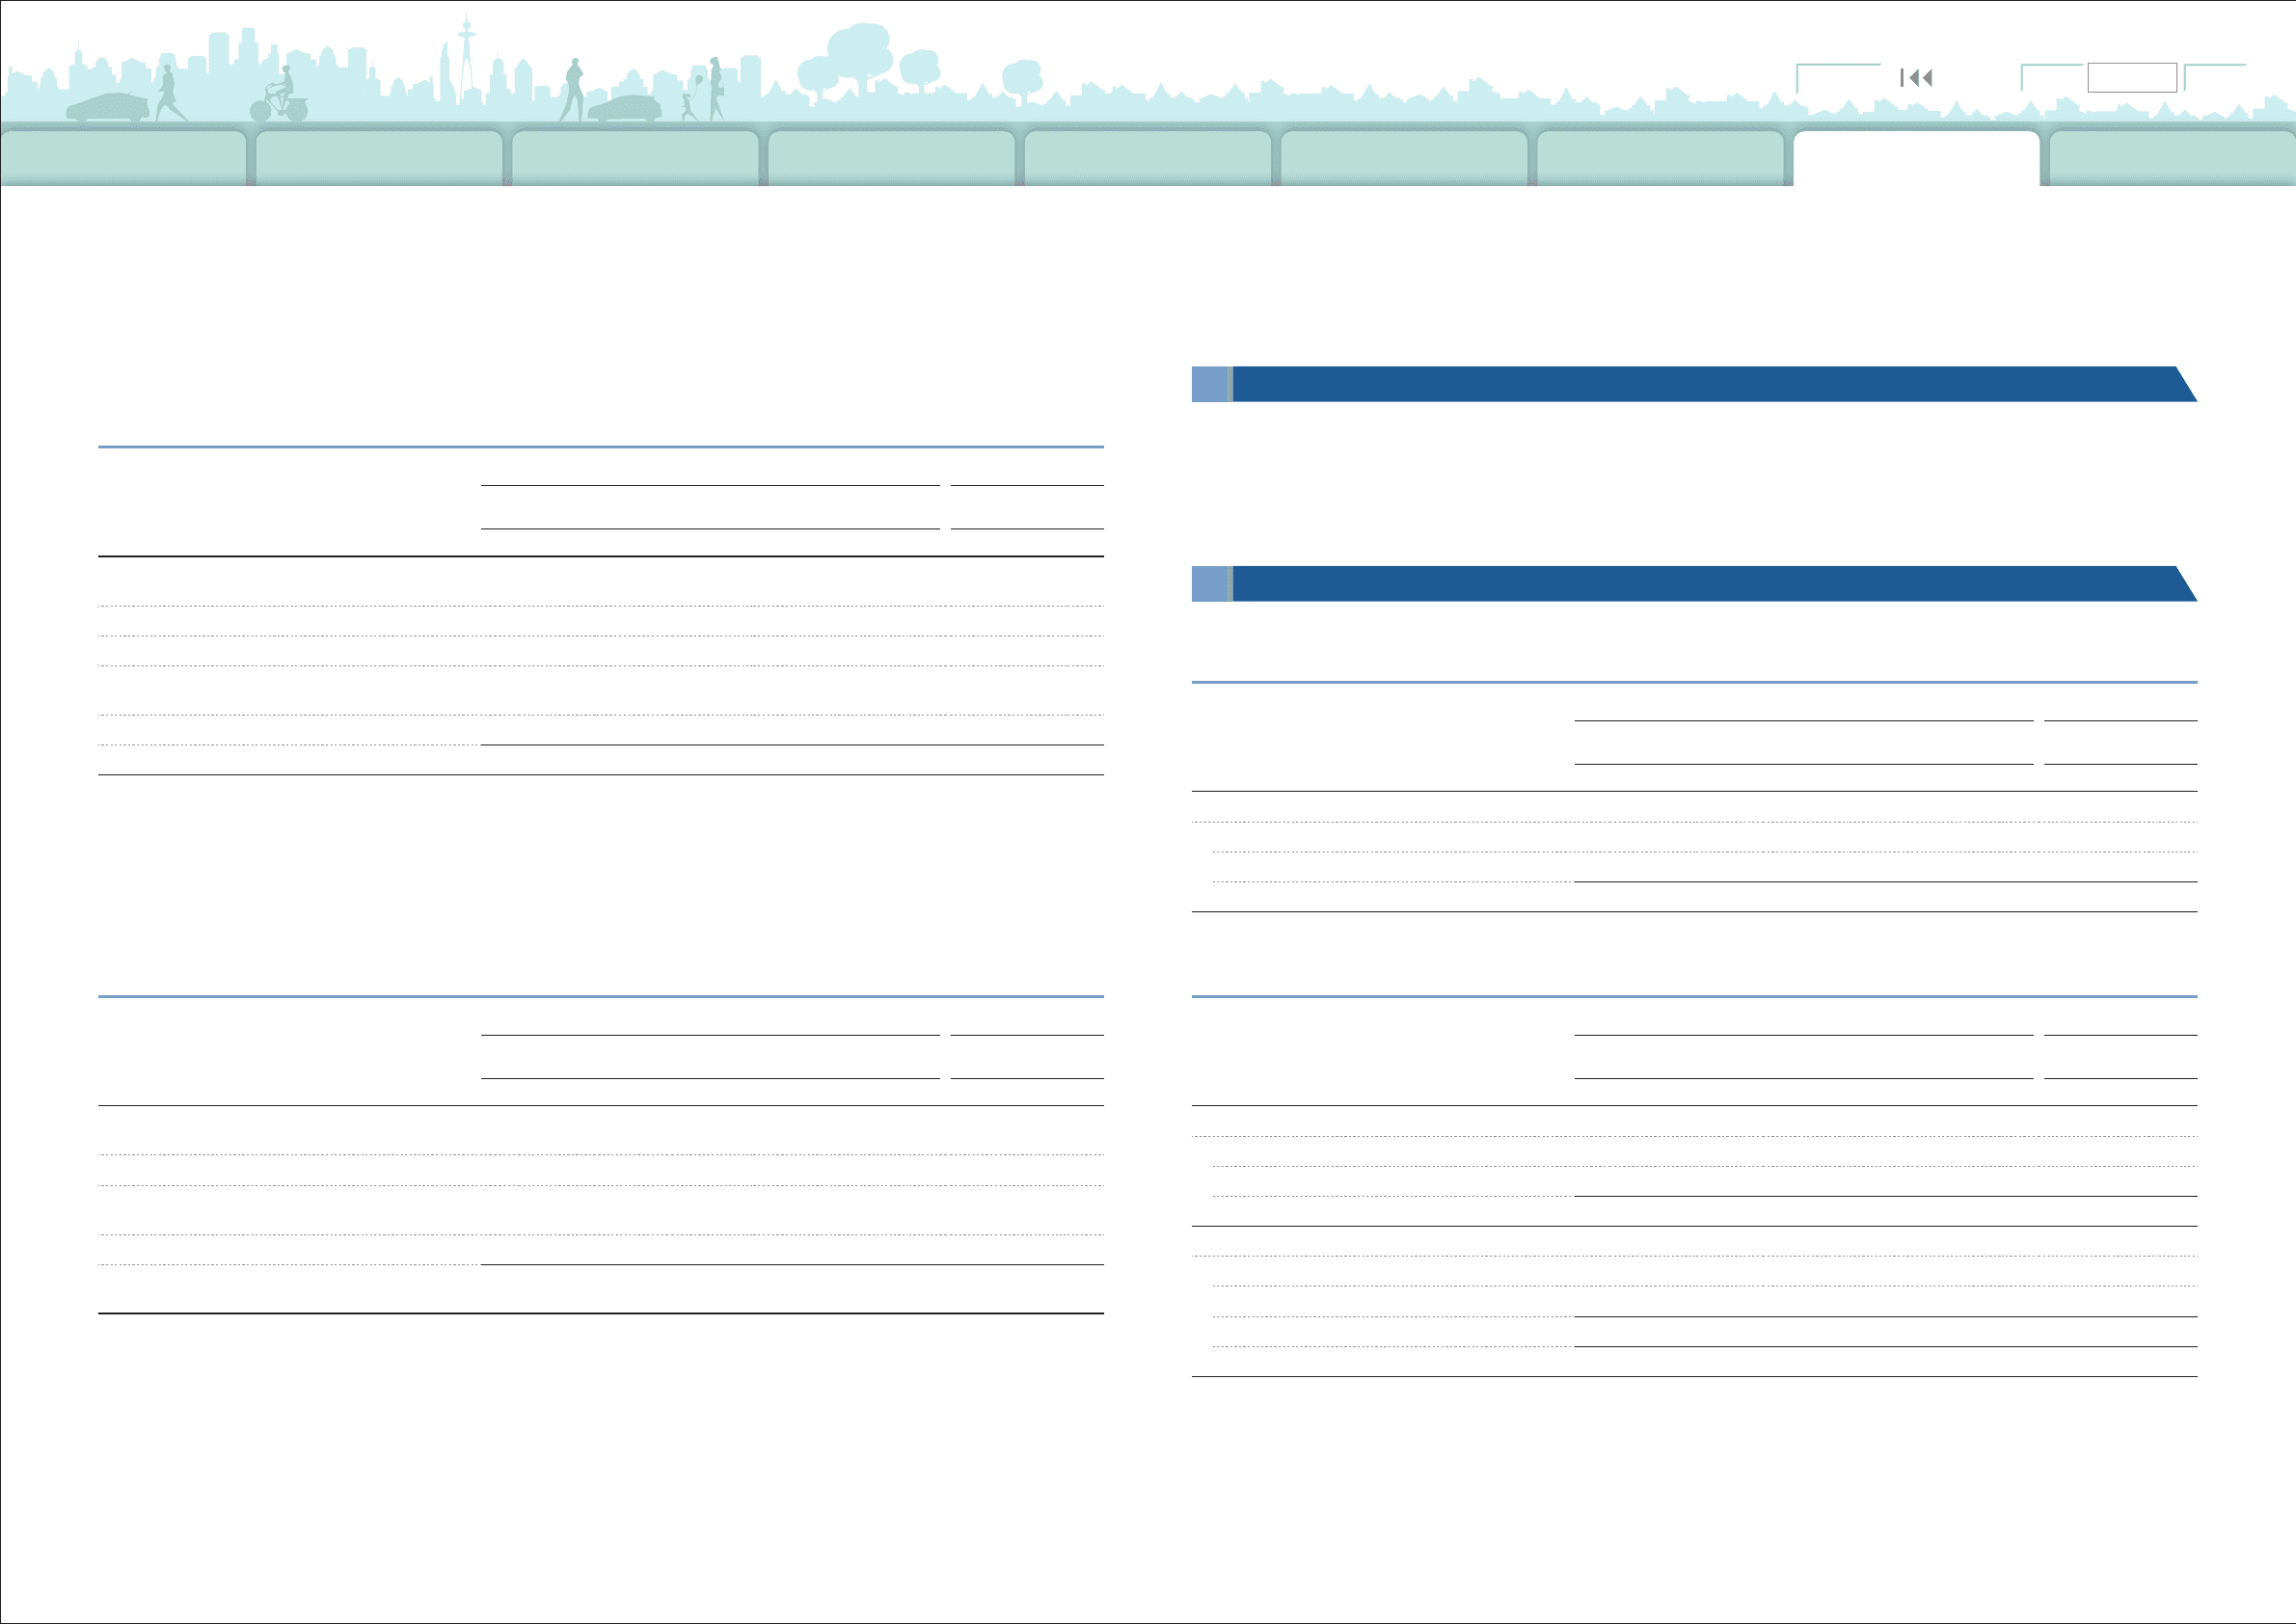
Notes to Consolidated Financial Statements
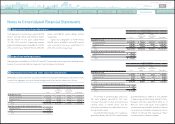
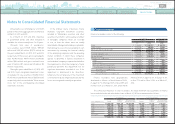
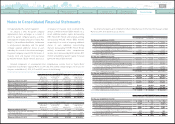
The net changes in liabilities for quality assurances above for the years ended March 31, 2010, 2011
and 2012 consist of the following:
The other amount primarily includes the impact of currency translation adjustments and the impact
of consolidation and deconsolidation of certain entities due to changes in ownership interest.
The table below shows the net changes in liabilities for recalls and other safety measures which are
comprised in liabilities for quality assurances above for the years ended March 31, 2010, 2011 and 2012.
Yen in millions
U.S. dollars in millions
For the years ended March 31,
For the year ended
March 31,
2010 2011 2012 2012
Liabilities for quality assurances at
beginning of year ¥568,834 ¥ 680,408 ¥764,369 $ 9,300
Payments made during year
(
425,976
) (
476,771
)(
348,214
) (
4,237
)
Provision for quality assurances 558,190 588,224 436,891 5,316
Changes relating to pre-existing quality
assurances
(
21,606
) (
1,701
)(
7,827
) (
95
)
Other 966
(
25,791
)(
5,385
) (
66
)
Liabilities for quality assurances at end of year
¥680,408 ¥ 764,369 ¥839,834 $10,218
Yen in millions
U.S. dollars in millions
For the years ended March 31,
For the year ended
March 31,
2010 2011 2012 2012
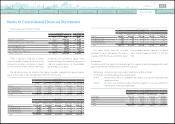
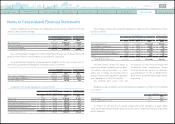
Income
(
loss
)
before income taxes:
Parent company and domestic subsidiaries
¥
(
114,569
)
¥
(
278,229
)
¥
(
177,852
)
$
(
2,164
)
Foreign subsidiaries 406,037 841,519 610,725 7,431
¥ 291,468 ¥ 563,290 ¥ 432,873 $ 5,267
Yen in millions
U.S. dollars in millions
For the years ended March 31,
For the year ended
March 31,
2010 2011 2012 2012
Current income tax expense:
Parent company and domestic subsidiaries
¥ 65,971 ¥ 85,290 ¥ 111,363 $ 1,355
Foreign subsidiaries 1,156 141,821 144,514 1,758
Total current 67,127 227,111 255,877 3,113
Deferred income tax expense
(
benefit
)
:
Parent company and domestic subsidiaries
(
126,716
) (
44,268
)(
57,940
) (
705
)
Foreign subsidiaries 152,253 129,978 64,335 783
Total deferred 25,537 85,710 6,395 78
Total provision ¥ 92,664 ¥ 312,821 ¥ 262,272 $ 3,191
Yen in millions
U.S. dollars in millions
For the years ended March 31,
For the year ended
March 31,
2010 2011 2012 2012
Liabilities for recalls and other safety
measures at beginning of year ¥ 139,577 ¥301,422 ¥389,499 $ 4,739
Payments made during year
(
89,796
) (
263,096
)(
159,344
) (
1,939
)
Provision for recalls and other safety
measures 256,981*356,749 237,907 2,895
Other
(
5,340
) (
5,576
)
635 8
Liabilities for recalls and other safety
measures at end of year ¥301,422 ¥ 389,499 ¥468,697 $ 5,703
* Toyota has employed an estimation model to accrue expenses for future recalls and other safety measures at the time of vehicle sale based
on the amount estimated from historical experience from the fourth quarter of the fiscal year ended March 31, 2010. This change has resulted
in an increase in provision for recalls and other safety measures in this table by ¥105,698 million.
Other payables: 15
Income taxes: 16
Other payables are mainly related to purchases of property, plant and equipment and non-manufacturing
purchases.
The components of income
(
loss
)
before income taxes comprise the following:
The provision for income taxes consists of the following:
0820
Search NextPrev page 97
Contents