Toyota 2012 Annual Report Download - page 47
Download and view the complete annual report
Please find page 47 of the 2012 Toyota annual report below. You can navigate through the pages in the report by either clicking on the pages listed below, or by using the keyword search tool below to find specific information within the annual report.-
 1
1 -
2
-
3
-
4
-
5
-
6
-
7
-
8
-
9
-
10
-
11
-
12
-
13
-
14
-
15
-
16
-
17
-
18
-
19
-
20
-
21
-
22
-
23
-
24
-
25
-
26
-
27
-
28
-
29
-
30
-
31
-
32
-
33
-
34
-
35
-
36
-
 37
37 -
 38
38 -
 39
39 -
 40
40 -
 41
41 -
 42
42 -
 43
43 -
 44
44 -
 45
45 -
 46
46 -
 47
47 -
 48
48 -
 49
49 -
 50
50 -
 51
51 -
 52
52 -
 53
53 -
 54
54 -
 55
55 -
 56
56 -
 57
57 -
58
-
59
-
60
-
61
-
62
-
63
-
64
-
65
-
66
-
67
-
68
-
69
-
70
-
71
-
72
-
73
-
74
-
75
-
76
-
77
-
78
-
79
-
80
-
81
-
82
-
83
-
84
-
85
-
86
-
87
-
88
-
89
-
90
-
91
-
92
-
93
-
94
-
95
-
96
-
97
-
98
-
99
-
100
-
101
-
102
-
103
-
104
-
105
-
106
-
107
-
108
-
109
-
110
-
111
-
112
-
113
-
114
-
115
-
116
-
117
-
118
-
119
-
120
-
121
-
122
-
123
-
124
-
125
-
126
-
127
 |
 |

TOYOTA ANNUAL REPORT 2012
Toyota Global Vision Changes for Making
Ever-Better Cars President
ʼ
s Message Medium- to Long-Term
Growth Initiatives Special Feature Management and
Corporate Information Investor Information
Business and
Performance Review Financial Section
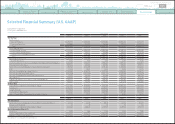
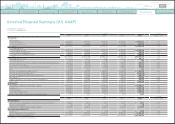
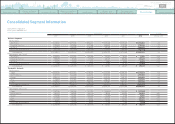
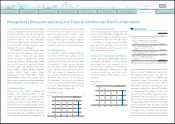
Consolidated Segment Information
Yen in millions % change
2007 2008 2009 2010 2011 2012 2012 vs. 2011
Business Segment:
Net Revenues:
Automotive ¥21,928,006 ¥24,177,306 ¥18,564,723 ¥17,197,428 ¥17,337,320 ¥16,994,546
-
2.0
Financial Services 1,300,548 1,498,354 1,377,548 1,245,407 1,192,205 1,100,324
-
7.7
All Other 1,323,731 1,346,955 1,184,947 947,615 972,252 1,048,915 +7.9
Intersegment Elimination
(
604,194
) (
733,375
) (
597,648
) (
439,477
) (
508,089
)(
560,132
)―
Consolidated ¥23,948,091 ¥26,289,240 ¥20,529,570 ¥18,950,973 ¥18,993,688 ¥18,583,653
-
2.2
Operating Income
(
Loss
)
:
Automotive ¥ 2,038,828 ¥ 2,171,905 ¥
(
394,876
)
¥
(
86,370
)
¥ 85,973 ¥ 21,683
-
74.8
Financial Services 158,495 86,494
(
71,947
)
246,927 358,280 306,438
-
14.5
All Other 39,679 33,080 9,913
(
8,860
)
35,242 42,062 +19.4
Intersegment Elimination 1,681
(
21,104
) (
4,101
) (
4,181
) (
11,216
)(
14,556
)―
Consolidated ¥ 2,238,683 ¥ 2,270,375 ¥
(
461,011
)
¥ 147,516 ¥ 468,279 ¥ 355,627
-
24.1
Geographic Segment:
Net Revenues:
Japan ¥14,815,282 ¥15,315,812 ¥12,186,737 ¥11,220,303 ¥10,986,246 ¥11,167,319 +1.6
North America 9,029,773 9,423,258 6,222,914 5,670,526 5,429,136 4,751,886
-
12.5
Europe 3,542,193 3,993,434 3,013,128 2,147,049 1,981,497 1,993,946 +0.6
Asia 2,225,528 3,120,826 2,719,329 2,655,327 3,374,534 3,334,274
-
1.2
Other 1,922,742 2,294,137 1,882,900 1,673,861 1,809,116 1,760,175
-
2.7
Intersegment Elimination
(
7,587,427
) (
7,858,227
) (
5,495,438
) (
4,416,093
) (
4,586,841
)(
4,423,947
)―
Consolidated ¥23,948,091 ¥26,289,240 ¥20,529,570 ¥18,950,973 ¥18,993,688 ¥18,583,653
-
2.2
Operating Income
(
Loss
)
:
Japan ¥ 1,457,246 ¥ 1,440,286 ¥
(
237,531
)
¥
(
225,242
)
¥
(
362,396
)
¥
(
207,040
)―
North America 449,633 305,352
(
390,192
)
85,490 339,503 186,409
-
45.1
Europe 137,383 141,571
(
143,233
) (
32,955
)
13,148 17,796 +35.4
Asia 117,595 256,356 176,060 203,527 312,977 256,790
-
18.0
Other 83,497 143,978 87,648 115,574 160,129 108,814
-
32.0
Intersegment Elimination
(
6,671
) (
17,168
)
46,237 1,122 4,918
(
7,142
)―
Consolidated ¥ 2,238,683 ¥ 2,270,375 ¥
(
461,011
)
¥ 147,516 ¥ 468,279 ¥ 355,627
-
24.1
Toyota Motor Corporation
Fiscal years ended March 31
0820
Search NextPrev page 47
Contents