Toyota 2012 Annual Report Download - page 110
Download and view the complete annual report
Please find page 110 of the 2012 Toyota annual report below. You can navigate through the pages in the report by either clicking on the pages listed below, or by using the keyword search tool below to find specific information within the annual report.-
 1
1 -
2
-
3
-
4
-
5
-
6
-
7
-
8
-
9
-
10
-
11
-
12
-
13
-
14
-
15
-
16
-
17
-
18
-
19
-
20
-
21
-
22
-
23
-
24
-
25
-
26
-
27
-
28
-
29
-
30
-
31
-
32
-
33
-
34
-
35
-
36
-
37
-
38
-
39
-
40
-
41
-
42
-
43
-
44
-
45
-
46
-
47
-
48
-
49
-
50
-
51
-
52
-
53
-
54
-
55
-
56
-
57
-
58
-
59
-
60
-
61
-
62
-
63
-
64
-
65
-
66
-
67
-
68
-
69
-
70
-
71
-
72
-
73
-
74
-
75
-
76
-
77
-
78
-
79
-
80
-
81
-
82
-
83
-
84
-
85
-
86
-
87
-
88
-
89
-
90
-
91
-
92
-
93
-
94
-
95
-
96
-
97
-
98
-
99
-
 100
100 -
 101
101 -
 102
102 -
 103
103 -
 104
104 -
 105
105 -
 106
106 -
 107
107 -
 108
108 -
 109
109 -
 110
110 -
 111
111 -
 112
112 -
 113
113 -
 114
114 -
 115
115 -
 116
116 -
 117
117 -
 118
118 -
 119
119 -
 120
120 -
121
-
122
-
123
-
124
-
125
-
126
-
127
 |
 |
TOYOTA ANNUAL REPORT 2012
Toyota Global Vision Changes for Making
Ever-Better Cars President
ʼ
s Message Medium- to Long-Term
Growth Initiatives Special Feature Management and
Corporate Information Investor Information
Business and
Performance Review Financial Section
Notes to Consolidated Financial Statements
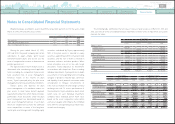
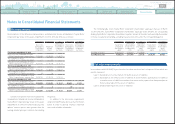
In the normal course of business, substantially all
cash and cash equivalents and time deposits are
highly liquid and are carried at amounts which
approximate fair value due to its short duration.
Cash equivalents and time deposits include
negotiable certificate of deposit measured at fair
value on a recurring basis. Where money market
funds produce a daily net asset value in an active
market, this value is used to determine the fair
value of the fund investment, and the investment
is classified in Level 1. All other types of cash and
cash equivalents and time deposits are classified
in Level 2.
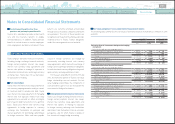
The fair values of finance receivables are estimated
by discounting expected cash flows to present value
using internal assumptions, including prepayment
speeds, expected credit losses and collateral
value. Certain impaired finance receivables are
measured at fair value on a nonrecurring basis
based on collateral values.
As unobservable inputs are utilized, finance
receivables are classified in Level 3.
Other receivables are short-term receivables.
Other receivables are carried at amounts which
approximate fair value, and the difference between
the carrying amount and the fair value is not material.
Other receivables are classified in Level 3.
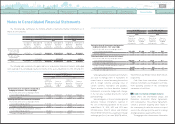
The fair values of short-term borrowings and
total long-term debt including the current
portion, except for secured loans provided
by securitization transactions using special-
purpose entities, are estimated based on the
discounted amounts of future cash flows using
Toyota
ʼ
s current borrowing rates for similar
liabilities. As these inputs are observable, these
loans are classified in Level 2.
The fair values of the secured loans provided
by securitization transactions are estimated
based on current market rates and credit
spreads for debt with similar maturities. Internal
assumptions including prepayment speeds and
expected credit losses are used to estimate the
timing of cash flows to be paid on the underlying
securitized assets. As these valuations utilize
unobservable inputs, the secured loans
are classified in Level 3. See note 12 to the
consolidated financial statements for information
regarding the secured loans.
■
Cash and cash equivalents and
time deposits
■
Short-term borrowings and long-term debt
■
Finance receivables, net
■
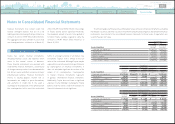
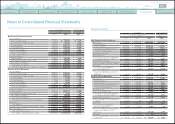
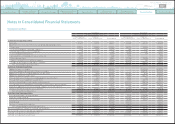
Other receivables Lease commitments:22
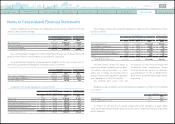
Toyota leases certain assets under capital lease and operating lease arrangements.
An analysis of leased assets under capital leases is as follows:
Amortization expenses under capital leases for the years ended March 31, 2010, 2011 and 2012 were
¥7,587 million, ¥5,966 million and ¥5,572 million
(
$68 million
)
, respectively.
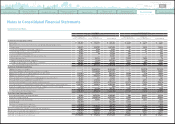
Future minimum lease payments under capital leases together with the present value of the net
minimum lease payments as of March 31, 2012 are as follows:
Rental expenses under operating leases for the years ended March 31, 2010, 2011 and 2012 were
¥93,994 million, ¥89,029 million and ¥91,052 million
(
$1,108 million
)
, respectively.
Yen in millions
U.S. dollars in millions
March 31, March 31,
Class of property 2011 2012 2012
Building ¥ 13,412 ¥12,230 $ 149
Machinery and equipment 30,283 31,698 386
Less - Accumulated depreciation
(
18,590
)(
20,284
) (
247
)
¥ 25,105 ¥23,644 $ 288
Years ending March 31, Yen in millions
U.S. dollars in millions
2013 ¥ 5,023 $ 61
2014 3,431 42
2015 2,601 32
2016 2,415 29
2017 2,077 25
Thereafter 12,636 154
Total minimum lease payments 28,183 343
Less - Amount representing interest
(
6,835
) (
83
)
Present value of net minimum lease payments 21,348 260
Less - Current obligations
(
4,175
) (
51
)
Long-term capital lease obligations ¥ 17,173 $ 209
0820
Search NextPrev page 110
Contents