Bank of America 2002 Annual Report Download - page 107
Download and view the complete annual report
Please find page 107 of the 2002 Bank of America annual report below. You can navigate through the pages in the report by either clicking on the pages listed below, or by using the keyword search tool below to find specific information within the annual report.-
 1
1 -
2
-
3
-
4
-
5
-
6
-
7
-
8
-
9
-
10
-
11
-
12
-
13
-
14
-
15
-
16
-
17
-
18
-
19
-
20
-
21
-
22
-
23
-
24
-
25
-
26
-
27
-
28
-
29
-
30
-
31
-
32
-
33
-
34
-
35
-
36
-
37
-
38
-
39
-
40
-
41
-
42
-
43
-
44
-
45
-
46
-
47
-
48
-
49
-
50
-
51
-
52
-
53
-
54
-
55
-
56
-
57
-
58
-
59
-
60
-
61
-
62
-
63
-
64
-
65
-
66
-
67
-
68
-
69
-
70
-
71
-
72
-
73
-
74
-
75
-
76
-
77
-
78
-
79
-
80
-
81
-
82
-
83
-
84
-
85
-
86
-
87
-
88
-
89
-
90
-
91
-
92
-
93
-
94
-
95
-
96
-
 97
97 -
 98
98 -
 99
99 -
 100
100 -
 101
101 -
 102
102 -
 103
103 -
 104
104 -
 105
105 -
 106
106 -
 107
107 -
 108
108 -
 109
109 -
 110
110 -
 111
111 -
 112
112 -
 113
113 -
 114
114 -
 115
115 -
 116
116
 |
 |

BANK OF AMERICA 2002 105
The Corporation’s current income tax expense approximates the
amounts payable for those years. Deferred income tax expense rep-
resents the change in the deferred tax asset or liability and is dis-
cussed further below.
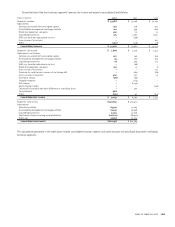
A reconciliation of the expected federal income tax expense
using the federal statutory tax rate of 35 percent to the actual
income tax expense for the years ended December 31, 2002, 2001 and
2000 follows:
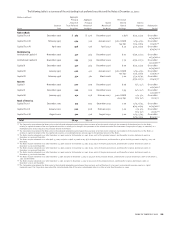
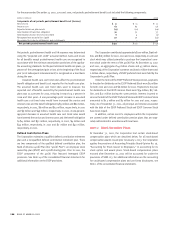
The following table summarizes information about stock options outstanding at December 31, 2002:
Outstanding Options Options Exercisable
Number Weighted- Weighted- Number Weighted-
Outstanding at Average Average Exercisable at Average
Range of Exercise Prices December 31 Remaining Term Exercise Price December 31 Exercise Price
$10.00 - $30.00 5,503,368 2.2 years $24.21 5,503,368 $24.21
$30.01 - $46.50 4,349,303 3.5 years 36.20 4,292,885 36.10
$46.51 - $65.50 173,277,283 5.4 years 57.10 58,890,204 56.63
$65.51 - $99.00 22,593,696 4.2 years 79.09 20,889,513 79.67
Total 205,723,650 5.1 years $58.19 89,575,970 $59.02
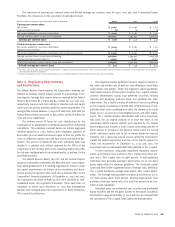
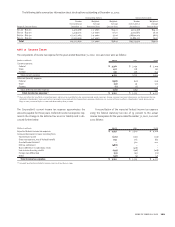
NOTE 18 Income Taxes
The components of income tax expense for the years ended December 31, 2002, 2001 and 2000 were as follows:
(Dollars in millions)
2002 2001 2000
Current expense:
Federal $ 3,361 $ 3,154 $ 3,109
State 427 218 161
Foreign 331 338 354
Total current expense 4,119 3,710 3,624
Deferred (benefit) expense:
Federal (338) (411) 526
State (37) 29 120
Foreign (2) (3) 1
Total deferred (benefit) expense (377) (385) 647
Total income tax expense(1) $3,742 $ 3,325 $ 4,271
(1) Does not reflect the tax effects of unrealized gains and losses on available-for-sale and marketable equity securities, foreign currency translation adjustments and derivatives that are
included in shareholders’ equity and certain tax benefits associated with the Corporation’s employee stock plans. As a result of these tax effects, shareholders’ equity decreased by
$839 in 2002, increased by $21 in 2001 and decreased by $684 in 2000.
(Dollars in millions)
2002 2001 2000
Expected federal income tax expense $ 4,547 $ 3,541 $ 4,126
Increase (decrease) in taxes resulting from:
Tax-exempt income (270) (107) (116)
State tax expense, net of federal benefit 253 161 183
Goodwill amortization(1) –361 202
IRS tax settlement (488) ––
Basis difference in subsidiary stock –(418) –
Low income housing credits (197) (146) (108)
Foreign tax differential (57) (63) (72)
Other (46) (4) 56
Total income tax expense $3,742 $ 3,325 $ 4,271
(1) Goodwill amortization included in business exit costs was $164 in 2001.