Bank of America 2002 Annual Report Download - page 46
Download and view the complete annual report
Please find page 46 of the 2002 Bank of America annual report below. You can navigate through the pages in the report by either clicking on the pages listed below, or by using the keyword search tool below to find specific information within the annual report.-
 1
1 -
2
-
3
-
4
-
5
-
6
-
7
-
8
-
9
-
10
-
11
-
12
-
13
-
14
-
15
-
16
-
17
-
18
-
19
-
20
-
21
-
22
-
23
-
24
-
25
-
26
-
27
-
28
-
29
-
30
-
31
-
32
-
33
-
34
-
35
-
 36
36 -
 37
37 -
 38
38 -
 39
39 -
 40
40 -
 41
41 -
 42
42 -
 43
43 -
 44
44 -
 45
45 -
 46
46 -
 47
47 -
 48
48 -
 49
49 -
 50
50 -
 51
51 -
 52
52 -
 53
53 -
 54
54 -
 55
55 -
 56
56 -
57
-
58
-
59
-
60
-
61
-
62
-
63
-
64
-
65
-
66
-
67
-
68
-
69
-
70
-
71
-
72
-
73
-
74
-
75
-
76
-
77
-
78
-
79
-
80
-
81
-
82
-
83
-
84
-
85
-
86
-
87
-
88
-
89
-
90
-
91
-
92
-
93
-
94
-
95
-
96
-
97
-
98
-
99
-
100
-
101
-
102
-
103
-
104
-
105
-
106
-
107
-
108
-
109
-
110
-
111
-
112
-
113
-
114
-
115
-
116
 |
 |

44 BANK OF AMERICA 2002
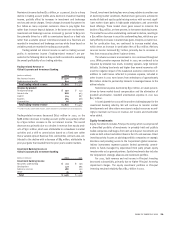
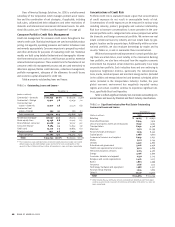
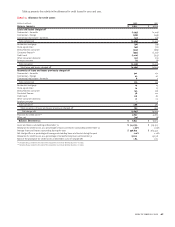
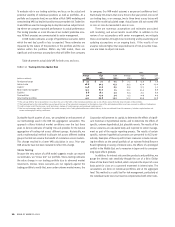
TABLE 13 Nonperforming Assets(1)
December 31
(Dollars in millions)
2002 2001
Commercial – domestic $ 2,781 $ 3,123
Commercial – foreign 1,359 461
Commercial real estate – domestic 161 240
Commercial real estate – foreign 33
Total commercial 4,304 3,827
Residential mortgage 612 556
Home equity lines 66 80
Direct/Indirect consumer 30 27
Consumer finance 19 9
Foreign consumer 67
Total consumer 733 679
Total nonperforming loans 5,037 4,506
Foreclosed properties 225 402
Total nonperforming assets $ 5,262 $ 4,908
(1) In 2002, $668 in interest income was contractually due on nonperforming loans and troubled debt restructured loans. Of this amount, $193 was actually recorded as interest income in 2002.
The Corporation has been devoting particular attention to
Argentina and Brazil, which have been significantly impacted by
negative global economic pressure.
Throughout 2001, Argentina’s economy and political environ-
ment deteriorated sharply, finally ending in December 2001 with the
collapse of the Argentine peso. As a result of these events, at the end
of 2001, the Argentine government defaulted on its obligations and
during all of 2002, local companies faced serious difficulties servicing
their debt. In response to the economic climate in Argentina, the
Corporation reduced its credit exposure in the country in 2002 by
$280 million to $465 million. Of that $465 million, $339 million
represented traditional credit exposure (loans, letters of credit, etc.)
predominantly to Argentine subsidiaries of foreign multinational
corporations. Additional credit exposure was attributable to $62 mil-
lion in Argentina government bonds. Net charge-offs in 2002 totaled
$113 million. The allowance for credit losses associated with out-
standing loans and leases related to Argentina was $154 million at
December 31, 2002.
In response to uncertain economic conditions in Brazil, the
Corporation has reduced its credit exposure by 53 percent to $1.2 bil-
lion at December 31, 2002. The decline was due to loan maturities and
lower level of local issuer risk. Of this amount, $562 million repre-
sented traditional credit exposure (loans, letters of credit, etc.) and
$290 million was Brazilian government securities. Derivatives expo-
sure totaled $55 million. The allowance for credit losses related to
Brazil consisted of $60 million related to traditional credit expo-
sure.
An additional $6 million is reserved for derivatives exposure.
Nonperforming Assets and Net Charge-offs
We routinely review the loan and lease portfolio to determine if any
credit exposure should be placed on nonperforming status. An asset
is placed on nonperforming status when it is determined that princi-
pal and interest are not expected to be fully collected in accordance
with its contractual terms. Nonperforming asset levels, presented in
Table 13, continue to be adversely affected by the weakened eco-
nomic environment. Sales of nonperforming assets during 2002
totaled $543 million, comprised of $296 million of nonperforming
commercial loans, $105 million of nonperforming residential
mortgage loans and $142 million of foreclosed properties.
In 2001 and continuing in 2002 sporadic large single company
events and issues in certain industries have impacted nonperform-
ing assets and consequently our provision for credit losses. These
losses resulted from a multitude of factors including business failures
as a result of financial reporting fraud, the prolonged weak economic
environment and industry specific issues. It is difficult to predict the
timing of such event risk and as a consequence the timing and
amount of loss potential is more difficult to estimate.
Nonperforming commercial – domestic loans decreased $342 mil-
lion to 2.65 percent of commercial – domestic loans at December 31,
2002 from 2.64 percent at December 31, 2001. Nonperforming commer-
cial – foreign loans increased $898 million to 6.83 percent of com-
mercial – foreign loans at December 31, 2002 from 2.00 percent at
December 31, 2001. The increase was primarily attributable to media
and telecommunications services firms located in Western Europe and
in Latin America.
Credit exposure to companies in the telecommunications
service industry that were in bankruptcy at December 31, 2002
totaled $190 million, with associated reserves of $44 million. Net
charge-offs associated with credit exposure to these telecommunica-
tions services companies were $105 million for 2002.
At December 31, 2002 and 2001, Argentine nonperforming loans
were $278 million and $40 million, respectively. Nonperforming loans
in Brazil were $90 million at December 31, 2002 compared to $2 mil-
lion at December 31, 2001.
Within the consumer portfolio, nonperforming loans increased
$54 million to $733 million, or 0.37 percent of consumer loans, at
December 31, 2002 from $679 million or 0.41 percent at December 31,
2001, primarily due to higher levels of residential mortgage loans
being held in the portfolio, partially offset by the sale of nonperforming
residential mortgage loans during the first quarter of 2002.
The Corporation also had approximately $4 million and $48 mil-
lion of troubled debt restructured loans at December 31, 2002 and
2001, respectively, that were accruing interest and were not included
in nonperforming assets.