Bank of America 2002 Annual Report Download - page 90
Download and view the complete annual report
Please find page 90 of the 2002 Bank of America annual report below. You can navigate through the pages in the report by either clicking on the pages listed below, or by using the keyword search tool below to find specific information within the annual report.-
 1
1 -
2
-
3
-
4
-
5
-
6
-
7
-
8
-
9
-
10
-
11
-
12
-
13
-
14
-
15
-
16
-
17
-
18
-
19
-
20
-
21
-
22
-
23
-
24
-
25
-
26
-
27
-
28
-
29
-
30
-
31
-
32
-
33
-
34
-
35
-
36
-
37
-
38
-
39
-
40
-
41
-
42
-
43
-
44
-
45
-
46
-
47
-
48
-
49
-
50
-
51
-
52
-
53
-
54
-
55
-
56
-
57
-
58
-
59
-
60
-
61
-
62
-
63
-
64
-
65
-
66
-
67
-
68
-
69
-
70
-
71
-
72
-
73
-
74
-
75
-
76
-
77
-
78
-
79
-
 80
80 -
 81
81 -
 82
82 -
 83
83 -
 84
84 -
 85
85 -
 86
86 -
 87
87 -
 88
88 -
 89
89 -
 90
90 -
 91
91 -
 92
92 -
 93
93 -
 94
94 -
 95
95 -
 96
96 -
 97
97 -
 98
98 -
 99
99 -
 100
100 -
101
-
102
-
103
-
104
-
105
-
106
-
107
-
108
-
109
-
110
-
111
-
112
-
113
-
114
-
115
-
116
 |
 |

88 BANK OF AMERICA 2002
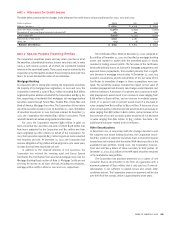
Fair Value and Cash Flow Hedges
The Corporation uses various types of interest rate and foreign currency
exchange rate derivative contracts to protect against changes in the fair
value of its fixed-rate assets and liabilities due to fluctuations in interest
rates and exchange rates. The Corporation also uses these types of con-
tracts to protect against changes in the cash flows of its variable-rate
assets and liabilities and anticipated transactions. In 2002, the
Corporation recognized in the Consolidated Statement of Income a net
loss of $22 million (included in interest income) which represented the
ineffective portion of fair value hedges. In 2001, there were no material
gains or losses recognized which represented the ineffective portion of
fair value hedges. In 2002, the Corporation recognized in the
Consolidated Statement of Income a net loss of $28 million (included in
interest income and mortgage banking income) which represented the
ineffective portion of cash flow hedges. In 2001, there were no signifi-
cant gains or losses recognized which represented the ineffective por-
tion of cash flow hedges. At December 31, 2002 and 2001, the
Corporation has determined that there were no hedging positions where
it was probable that certain forecasted transactions may not occur
within the originally designated time period.
For cash flow hedges, gains and losses on derivative contracts
reclassified from accumulated other comprehensive income to current
period earnings are included in the line item in the Consolidated
Statement of Income in which the hedged item is recorded and in the
same period the hedged item affects earnings. Deferred net gains
on
derivative instruments of approximately $521 million (pre-tax)
included in accumulated other comprehensive income at December 31,
2002 are expected to be reclassified into earnings during the next
twelve months. These net gains reclassified into earnings are expected
to increase income or reduce expense on the hedged items.
Hedges of Net Investments in Foreign Operations
The Corporation uses forward exchange contracts, currency swaps and
nonderivative cash instruments that provide an economic hedge on its
net investments in foreign operations against adverse movements in
foreign currency exchange rates. In 2002 and 2001, the Corporation
experienced net foreign currency pre-tax gains of $103 million and pre-
tax losses of $138 million, respectively, related to its net investments
in foreign operations. These gains and losses were recorded as a
component of the foreign currency translation adjustment in other
comprehensive income. These gains and losses were largely offset by
net pre-tax losses of $102 million and net pre-tax gains of $132 million
related to derivative and non-derivative instruments designated as
hedges of this currency exposure during these same periods.
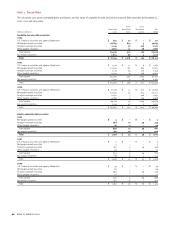
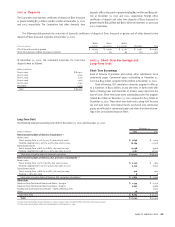
NOTE 6 Outstanding Loans and Leases
Outstanding loans and leases at December 31, 2002 and 2001 were:
(Dollars in millions)
2002 2001
Commercial – domestic $ 105,053 $ 118,205
Commercial – foreign 19,912 23,039
Commercial real estate – domestic 19,910 22,271
Commercial real estate – foreign 295 383
Total commercial 145,170 163,898
Residential mortgage 108,197 78,203
Home equity lines 23,236 22,107
Direct/Indirect consumer 31,068 30,317
Consumer finance 8,384 12,652
Credit card 24,729 19,884
Foreign consumer 1,971 2,092
Total consumer 197,585 165,255
Total $ 342,755 $ 329,153
The following table presents the recorded investment in specific
loans that were considered individually impaired in accordance with
SFAS 114 at December 31, 2002 and 2001:
(Dollars in millions)
2002 2001
Commercial – domestic $ 2,553 $ 3,138
Commercial – foreign 1,355 501
Commercial real estate – domestic 157 240
Commercial real estate – foreign 2–
Total impaired loans $ 4,067 $ 3,879
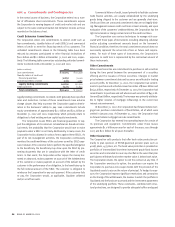
The average recorded investment in certain impaired loans for
2002, 2001, and 2000 was approximately $3.9 billion, $3.7 billion
and $3.0 billion, respectively. At December 31, 2002 and 2001, the
recorded investment in impaired loans requiring an allowance for
credit losses was $4.0 billion and $3.1 billion, and the related
allowance for credit losses was $919 million and $763 million,
respectively. For 2002, 2001 and 2000, interest income recognized
on impaired loans totaled $156 million, $195 million and $174 mil-
lion, respectively, all of which was recognized on a cash basis.
At December 31, 2002 and 2001, nonperforming loans, including
certain loans which were considered impaired, totaled $5.0 billion
and $4.5 billion, respectively. In addition, included in other assets
was $120 million and $1.0 billion of nonperforming assets at
December 31, 2002 and 2001, respectively.
Foreclosed properties amounted to $225 million and $402 mil-
lion at December 31, 2002 and 2001, respectively. The cost of carrying
foreclosed properties amounted to $7 million, $15 million and $12 mil-
lion in 2002, 2001, and 2000, respectively.