Bank of America 2002 Annual Report Download - page 30
Download and view the complete annual report
Please find page 30 of the 2002 Bank of America annual report below. You can navigate through the pages in the report by either clicking on the pages listed below, or by using the keyword search tool below to find specific information within the annual report.-
 1
1 -
2
-
3
-
4
-
5
-
6
-
7
-
8
-
9
-
10
-
11
-
12
-
13
-
14
-
15
-
16
-
17
-
18
-
19
-
 20
20 -
 21
21 -
 22
22 -
 23
23 -
 24
24 -
 25
25 -
 26
26 -
 27
27 -
 28
28 -
 29
29 -
 30
30 -
 31
31 -
 32
32 -
 33
33 -
 34
34 -
 35
35 -
 36
36 -
 37
37 -
 38
38 -
 39
39 -
 40
40 -
41
-
42
-
43
-
44
-
45
-
46
-
47
-
48
-
49
-
50
-
51
-
52
-
53
-
54
-
55
-
56
-
57
-
58
-
59
-
60
-
61
-
62
-
63
-
64
-
65
-
66
-
67
-
68
-
69
-
70
-
71
-
72
-
73
-
74
-
75
-
76
-
77
-
78
-
79
-
80
-
81
-
82
-
83
-
84
-
85
-
86
-
87
-
88
-
89
-
90
-
91
-
92
-
93
-
94
-
95
-
96
-
97
-
98
-
99
-
100
-
101
-
102
-
103
-
104
-
105
-
106
-
107
-
108
-
109
-
110
-
111
-
112
-
113
-
114
-
115
-
116
 |
 |

28 BANK OF AMERICA 2002
Shareholder value added (SVA) is a key non-GAAP measure of
performance used in managing our growth strategy orientation and
that strengthens our focus on generating long-term growth and
shareholder value. SVA is used in measuring performance of our
different business units and is an integral component for allocating
resources. Each business segment has a goal for growth in SVA
reflecting the individual segment’s business and customer strategy.
Investment resources and initiatives are aligned with these SVA
growth goals during the planning and forecasting process. Investment,
relationship and profitability models all have SVA as a key measure
to support the implementation of SVA growth goals.
SVA is defined
as cash basis earnings on an operating basis less a
charge for the
use of capital. Cash basis earnings is net income adjusted to exclude
amortization of intangibles. The charge for the use of capital is
calculated by multiplying 12 percent (management’s estimate of the
shareholders’ minimum required rate of return on capital invested) by
average total common shareholders’ equity at the corporate level
and by average allocated equity at the business segment level.
Equity
is allocated to the business segments using a
risk-adjusted
methodology for each segment’s credit, market, country
and oper-
ational risk. In 2002, we did not make any significant changes to the
methodology used to allocate the cost of capital. Effective January
2003, the Corporation will charge 11 percent for the use of capital.
Management believes that this decrease better reflects the changes
in investors’ expected returns in a lower growth rate environment.
SVA increased 22 percent to $3.8 billion in 2002 compared to the prior
year, due to both the $547 million increase in operating cash basis
earnings and the $1.1 billion reduction in average common share-
holders’ equity. For additional discussion of SVA, see Business
Segment Operations beginning on page 30.
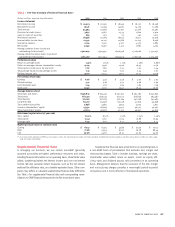
Management reviews net interest income on a taxable-equiv-
alent basis. In this non-GAAP presentation, net interest income is
adjusted to reflect tax-exempt interest income on an equivalent
before-tax basis. This measure ensures comparability of net interest
income arising from both taxable and tax-exempt sources. Net interest
income on a taxable-equivalent basis is also used in the calculation
of the efficiency ratio and the net interest yield. The efficiency ratio,
which is calculated by dividing noninterest expense by total revenue,
measures how much it costs to produce one dollar of revenue. Net
interest income on a taxable-equivalent basis is also used in our
business segment reporting.
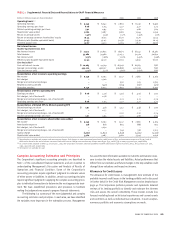
Additionally, management reviews “core net interest income,”
which adjusts reported net interest income on a taxable-equivalent
basis for the impact of trading-related activities and loans origi-
nated by the Corporation and sold into revolving credit card and
commercial securitizations. Noninterest income, rather than net
interest income, is recorded for assets that have been securitized as
the Corporation takes on the role of servicer and records servicing
income and gains or losses on securitizations, where appropriate.
For purposes of internal analysis, management combines trading-
related net interest income with trading account profits, as dis-
cussed in the Global Corporate and Investment Banking business
segment discussion beginning on page 34, as trading strategies are
evaluated based on total revenue.
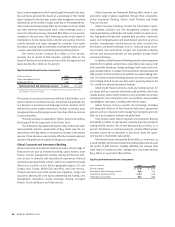
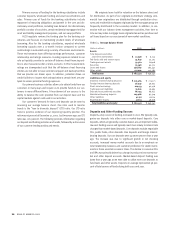
Core net interest income increased $344 million in 2002. This
increase was driven by the impact of higher levels of securities and
residential mortgage loans, higher levels of core deposit funding, con-
sumer loan growth and the absence of 2001 losses associated with
auto lease financing. The securitization of the subprime real estate
loans and reduced commercial loan levels negatively impacted core
net interest income relative to 2001.
Core average earning assets decreased $13.1 billion in 2002,
primarily due to exiting unprofitable commercial loan relationships,
the decline in subprime real estate loans (net of the remaining securi-
tization) and auto lease financing, partially offset by higher levels of
securities and residential mortgage loans.
The core net interest yield increased 20 basis points in 2002,
mainly due to a favorable shift in loan mix, higher levels of core
deposit funding, the absence of 2001 losses associated with auto
lease financing and higher levels of securities and residential mort-
gage loans, partially offset by the impact of the securitization of
subprime real estate loans.