Bank of America 2002 Annual Report Download - page 63
Download and view the complete annual report
Please find page 63 of the 2002 Bank of America annual report below. You can navigate through the pages in the report by either clicking on the pages listed below, or by using the keyword search tool below to find specific information within the annual report.-
 1
1 -
2
-
3
-
4
-
5
-
6
-
7
-
8
-
9
-
10
-
11
-
12
-
13
-
14
-
15
-
16
-
17
-
18
-
19
-
20
-
21
-
22
-
23
-
24
-
25
-
26
-
27
-
28
-
29
-
30
-
31
-
32
-
33
-
34
-
35
-
36
-
37
-
38
-
39
-
40
-
41
-
42
-
43
-
44
-
45
-
46
-
47
-
48
-
49
-
50
-
51
-
52
-
 53
53 -
 54
54 -
 55
55 -
 56
56 -
 57
57 -
 58
58 -
 59
59 -
 60
60 -
 61
61 -
 62
62 -
 63
63 -
 64
64 -
 65
65 -
 66
66 -
 67
67 -
 68
68 -
 69
69 -
 70
70 -
 71
71 -
 72
72 -
 73
73 -
74
-
75
-
76
-
77
-
78
-
79
-
80
-
81
-
82
-
83
-
84
-
85
-
86
-
87
-
88
-
89
-
90
-
91
-
92
-
93
-
94
-
95
-
96
-
97
-
98
-
99
-
100
-
101
-
102
-
103
-
104
-
105
-
106
-
107
-
108
-
109
-
110
-
111
-
112
-
113
-
114
-
115
-
116
 |
 |

BANK OF AMERICA 2002 61BANK OF AMERICA 2002 61
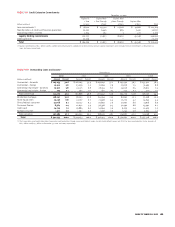
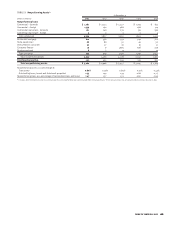
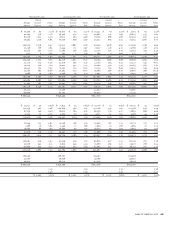
TABLE VII Credit Extension Commitments
December 31, 2002
Expires in Expires After Expires After
1 Year 1 Year Through 3 Years Through Expires After
(Dollars in millions) or Less 3 Years 5 Years 5 Years Total
Loan commitments(1) $ 98,101 $ 45,321 $ 27,616 $ 41,666 $ 212,704
Standby letters of credit and financial guarantees 20,002 6,440 985 3,410 30,837
Commercial letters of credit 2,674 162 1 272 3,109
Legally binding commitments 120,777 51,923 28,602 45,348 246,650
Credit card lines 73,779 – – – 73,779
Total $ 194,556 $ 51,923 $ 28,602 $ 45,348 $ 320,429
(1) Equity commitments of $2.2 billion and $2.5 billion primarily related to obligations to fund existing venture capital investments were included in loan commitments at December 31,
2002 and 2001, respectively.
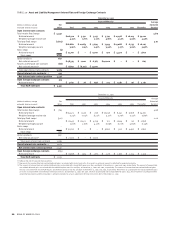
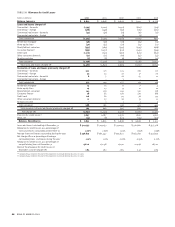
TABLE VIII Outstanding Loans and Leases(1)
December 31
2002 2001 2000 1999 1998
(Dollars in millions)
Amount Percent Amount Percent Amount Percent Amount Percent Amount Percent
Commercial – domestic $ 105,053 30.6 $ 118,205 35.9 $ 146,040 37.2 $ 143,450 38.7 $ 137,422 38.5
Commercial – foreign 19,912 5.8 23,039 7.0 31,066 7.9 27,978 7.5 31,495 8.8
Commercial real estate – domestic 19,910 5.8 22,271 6.8 26,154 6.7 24,026 6.5 26,912 7.5
Commercial real estate – foreign 295 0.1 383 0.1 282 0.1 325 0.1 301 0.1
Total commercial 145,170 42.3 163,898 49.8 203,542 51.9 195,779 52.8 196,130 54.9
Residential mortgage 108,197 31.6 78,203 23.8 84,394 21.5 81,860 22.1 73,608 20.6
Home equity lines 23,236 6.8 22,107 6.7 21,598 5.5 17,273 4.7 15,653 4.4
Direct/Indirect consumer 31,068 9.1 30,317 9.2 29,859 7.6 31,997 8.6 31,918 8.9
Consumer finance 8,384 2.4 12,652 3.9 36,398 9.3 32,490 8.8 23,992 6.7
Credit card 24,729 7.2 19,884 6.0 14,094 3.6 9,019 2.4 12,425 3.5
Foreign consumer 1,971 0.6 2,092 0.6 2,308 0.6 2,244 0.6 3,602 1.0
Total consumer 197,585 57.7 165,255 50.2 188,651 48.1 174,883 47.2 161,198 45.1
Total $ 342,755 100.0 $ 329,153 100.0 $ 392,193 100.0 $370,662 100.0 $ 357,328 100.0
(1) The Corporation used credit derivatives to provide credit protection (single name credit default swaps, basket credit default swaps and CLOs) for loan counterparties in the amounts of
$16.7 billion and $14.5 billion at December 31, 2002 and 2001, respectively.