Bank of America 2002 Annual Report Download - page 60
Download and view the complete annual report
Please find page 60 of the 2002 Bank of America annual report below. You can navigate through the pages in the report by either clicking on the pages listed below, or by using the keyword search tool below to find specific information within the annual report.-
 1
1 -
2
-
3
-
4
-
5
-
6
-
7
-
8
-
9
-
10
-
11
-
12
-
13
-
14
-
15
-
16
-
17
-
18
-
19
-
20
-
21
-
22
-
23
-
24
-
25
-
26
-
27
-
28
-
29
-
30
-
31
-
32
-
33
-
34
-
35
-
36
-
37
-
38
-
39
-
40
-
41
-
42
-
43
-
44
-
45
-
46
-
47
-
48
-
49
-
 50
50 -
 51
51 -
 52
52 -
 53
53 -
 54
54 -
 55
55 -
 56
56 -
 57
57 -
 58
58 -
 59
59 -
 60
60 -
 61
61 -
 62
62 -
 63
63 -
 64
64 -
 65
65 -
 66
66 -
 67
67 -
 68
68 -
 69
69 -
 70
70 -
71
-
72
-
73
-
74
-
75
-
76
-
77
-
78
-
79
-
80
-
81
-
82
-
83
-
84
-
85
-
86
-
87
-
88
-
89
-
90
-
91
-
92
-
93
-
94
-
95
-
96
-
97
-
98
-
99
-
100
-
101
-
102
-
103
-
104
-
105
-
106
-
107
-
108
-
109
-
110
-
111
-
112
-
113
-
114
-
115
-
116
 |
 |

58 BANK OF AMERICA 200258 BANK OF AMERICA 2002
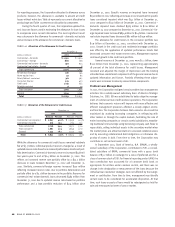
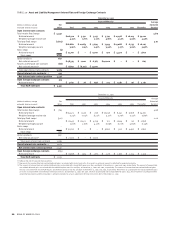
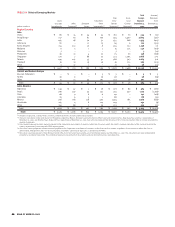
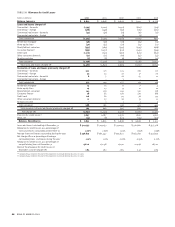
TABLE II Analysis of Changes in Net Interest Income – Taxable-Equivalent Basis
From 2001 to 2002 From 2000 to 2001
Due to Change in
(1)
Net Due to Change in
(1)
Net
■■■■■■■■■■■■■■■■■■■■■■■■■■■■■■■■
(Dollars in millions)
Volume Rate Change Volume Rate Change
Increase (decrease) in interest income
Time deposits placed and other short-term investments $ 157 $ (232) $ (75) $ 129 $ (147) $ (18)
Federal funds sold and securities purchased
under agreements to resell 421 (965) (544) (383) (557) (940)
Trading account assets 723 (516) 207 982 (80) 902
Securities 930 (591) 339 (1,446) 96 (1,350)
Loans and leases:
Commercial – domestic (1,759) (750) (2,509) (1,179) (967) (2,146)
Commercial – foreign (311) (432) (743) (204) (343) (547)
Commercial real estate – domestic (238) (419) (657) (114) (485) (599)
Commercial real estate – foreign 5 (8) (3) 4 (11) (7)
Total commercial (3,912) (3,299)
Residential mortgage 1,147 (644) 503 (717) (117) (834)
Home equity lines 58 (470) (412) 227 (350) (123)
Direct/Indirect consumer (9) (312) (321) (46) (177) (223)
Consumer finance (1,390) 4 (1,386) (603) (72) (675)
Credit card 538 (222) 316 768 (130) 638
Foreign consumer (10) (43) (53) – (68) (68)
Total consumer (1,353) (1,285)
Total loans and leases (5,265) (4,584)
Other earning assets 2 (550) (548) 1,315 (176) 1,139
Total interest income (5,886) (4,851)
Increase (decrease) in interest expense
Domestic interest-bearing deposits:
Savings 15 (90) (75) (43) (58) (101)
NOW and money market deposit accounts 376 (1,505) (1,129) 430 (873) (443)
Consumer CDs and IRAs (353) (532) (885) (162) (190) (352)
Negotiated CDs, public funds and other time deposits (80) (82) (162) (112) (79) (191)
Total domestic interest-bearing deposits (2,251) (1,087)
Foreign interest-bearing deposits:
Banks located in foreign countries (359) (252) (611) 276 (353) (77)
Governments and official institutions (54) (55) (109) (305) (56) (361)
Time, savings and other (148) (333) (481) (168) (428) (596)
Total foreign interest-bearing deposits (1,201) (1,034)
Total interest-bearing deposits (3,452) (2,121)
Federal funds purchased, securities sold under agreements to
repurchase and other short-term borrowings 530 (2,608) (2,078) (2,362) (1,428) (3,790)
Trading account liabilities 62 44 106 230 33 263
Long-term debt and trust preferred securities (196) (1,144) (1,340) (45) (1,120) (1,165)
Total interest expense (6,764) (6,813)
Net increase in net interest income $ 878 $ 1,962
(1) The changes for each category of interest income and expense are divided between the portion of change attributable to the variance in volume or rate for that category. The change in
rate/volume variance has been allocated to the rate variance.