Bank of America 2002 Annual Report Download - page 77
Download and view the complete annual report
Please find page 77 of the 2002 Bank of America annual report below. You can navigate through the pages in the report by either clicking on the pages listed below, or by using the keyword search tool below to find specific information within the annual report.-
 1
1 -
2
-
3
-
4
-
5
-
6
-
7
-
8
-
9
-
10
-
11
-
12
-
13
-
14
-
15
-
16
-
17
-
18
-
19
-
20
-
21
-
22
-
23
-
24
-
25
-
26
-
27
-
28
-
29
-
30
-
31
-
32
-
33
-
34
-
35
-
36
-
37
-
38
-
39
-
40
-
41
-
42
-
43
-
44
-
45
-
46
-
47
-
48
-
49
-
50
-
51
-
52
-
53
-
54
-
55
-
56
-
57
-
58
-
59
-
60
-
61
-
62
-
63
-
64
-
65
-
66
-
 67
67 -
 68
68 -
 69
69 -
 70
70 -
 71
71 -
 72
72 -
 73
73 -
 74
74 -
 75
75 -
 76
76 -
 77
77 -
 78
78 -
 79
79 -
 80
80 -
 81
81 -
 82
82 -
 83
83 -
 84
84 -
 85
85 -
 86
86 -
 87
87 -
88
-
89
-
90
-
91
-
92
-
93
-
94
-
95
-
96
-
97
-
98
-
99
-
100
-
101
-
102
-
103
-
104
-
105
-
106
-
107
-
108
-
109
-
110
-
111
-
112
-
113
-
114
-
115
-
116
 |
 |

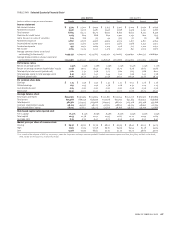
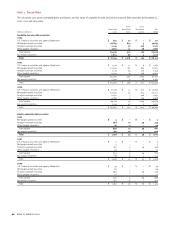
Consolidated Statement of Cash Flows
Bank of America Corporation and Subsidiaries
BANK OF AMERICA 2002 75BANK OF AMERICA 2002 75BANK OF AMERICA 2002 75
Year Ended December 31
(Dollars in millions)
2002 2001 2000
Operating activities
Net income $ 9,249 $ 6,792 $ 7,517
Reconciliation of net income to net cash provided by (used in) operating activities:
Provision for credit losses 3,697 4,287 2,535
Gains on sales of securities (630) (475) (25)
Business exit costs –1,305 –
Restructuring charges –– 550
Depreciation and premises improvements amortization 886 854 920
Amortization of intangibles 218 878 864
Deferred income tax (benefit) expense (377) (385) 647
Net (increase) decrease in trading and hedging instruments (12,357) (19,865) 819
Net increase in other assets (6,880) (14,336) (11,294)
Net increase (decrease) in accrued expenses and other liabilities (11,345) 5,004 1,934
Other operating activities, net 5,532 3,228 (958)
Net cash provided by (used in) operating activities (12,007) (12,713) 3,509
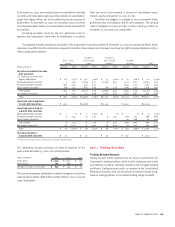
Investing activities
Net increase in time deposits placed and
other short-term investments (881) (484) (685)
Net (increase) decrease in federal funds sold and
securities purchased under agreements to resell (16,770) (53) 9,857
Proceeds from sales of available-for-sale securities 137,702 125,824 34,671
Proceeds from maturities of available-for-sale securities 26,777 11,722 6,396
Purchases of available-for-sale securities (146,010) (126,537) (19,132)
Proceeds from maturities of held-to-maturity securities 43 145 380
Proceeds from sales and securitizations of loans and leases 28,068 10,781 15,751
Other changes in loans and leases, net (37,184) 18,201 (42,720)
Purchases and originations of mortgage banking assets (919) (1,148) (208)
Net purchases of premises and equipment (939) (835) (642)
Proceeds from sales of foreclosed properties 142 353 260
(Acquisition) divestiture of business activities, net (110) (417) 843
Net cash provided by (used in) investing activities (10,081) 37,552 4,771
Financing activities
Net increase in deposits 12,963 9,251 17,155
Net increase (decrease) in federal funds purchased and
securities sold under agreements to repurchase 17,352 (1,684) (25,150)
Net increase (decrease) in commercial paper and other short-term borrowings 3,017 (19,981) (5,376)
Proceeds from issuance of long-term debt and trust preferred securities 10,850 14,853 23,451
Retirement of long-term debt and trust preferred securities (15,364) (20,619) (11,078)
Proceeds from issuance of common stock 2,632 1,121 294
Common stock repurchased (7,466) (4,716) (3,256)
Cash dividends paid (3,709) (3,632) (3,388)
Other financing activities, net (66) (51) (343)
Net cash provided by (used in) financing activities 20,209 (25,458) (7,691)
Effect of exchange rate changes on cash and cash equivalents 15 (57) (65)
Net increase (decrease) in cash and cash equivalents (1,864) (676) 524
Cash and cash equivalents at January 1 26,837 27,513 26,989
Cash and cash equivalents at December 31 $ 24,973 $ 26,837 $ 27,513
Supplemental cash flow disclosures
Cash paid for interest $ 11,253 $ 19,257 $ 24,241
Cash paid for income taxes 3,999 3,121 2,130
Net transfers of loans and leases from loans held for sale (included in other assets) to the loan portfolio amounted to $8,468 and $247 in 2002 and 2000, respectively. Net transfers of loans
and leases from the loan portfolio to loans held for sale amounted to $428 in 2001.
Loans transferred to foreclosed properties amounted to $285, $533 and $305 in 2002, 2001 and 2000, respectively.
There were no loans and loans held for sale securitized and retained in the available-for-sale portfolio in 2002. Loans and loans held for sale securitized and retained in the available-for-sale
securities portfolio amounted to $29,985 and $2,483 in 2001 and 2000, respectively.
See accompanying notes to consolidated financial statements.