Bank of America 2002 Annual Report Download - page 93
Download and view the complete annual report
Please find page 93 of the 2002 Bank of America annual report below. You can navigate through the pages in the report by either clicking on the pages listed below, or by using the keyword search tool below to find specific information within the annual report.-
 1
1 -
2
-
3
-
4
-
5
-
6
-
7
-
8
-
9
-
10
-
11
-
12
-
13
-
14
-
15
-
16
-
17
-
18
-
19
-
20
-
21
-
22
-
23
-
24
-
25
-
26
-
27
-
28
-
29
-
30
-
31
-
32
-
33
-
34
-
35
-
36
-
37
-
38
-
39
-
40
-
41
-
42
-
43
-
44
-
45
-
46
-
47
-
48
-
49
-
50
-
51
-
52
-
53
-
54
-
55
-
56
-
57
-
58
-
59
-
60
-
61
-
62
-
63
-
64
-
65
-
66
-
67
-
68
-
69
-
70
-
71
-
72
-
73
-
74
-
75
-
76
-
77
-
78
-
79
-
80
-
81
-
82
-
 83
83 -
 84
84 -
 85
85 -
 86
86 -
 87
87 -
 88
88 -
 89
89 -
 90
90 -
 91
91 -
 92
92 -
 93
93 -
 94
94 -
 95
95 -
 96
96 -
 97
97 -
 98
98 -
 99
99 -
 100
100 -
 101
101 -
 102
102 -
 103
103 -
104
-
105
-
106
-
107
-
108
-
109
-
110
-
111
-
112
-
113
-
114
-
115
-
116
 |
 |

BANK OF AMERICA 2002 91
December 31, 2002 December 31, 2001
Total Principal Principal Principal Total Principal Principal Principal
Amount of Amount of Loans Amount of Amount of Amount of Loans Amount of
Loans and Past Due Nonperforming Loans and Past Due Nonperforming
(Dollars in millions)
Leases 90 Days or More
(1)
Loans Leases 90 Days or More
(1)
Loans
Commercial – domestic $ 105,053 $ 132 $ 2,781 $ 120,159 $ 175 $ 3,123
Commercial – foreign 19,912 – 1,359 23,039 6 461
Commercial real estate – domestic 19,910 91 161 22,271 40 240
Commercial real estate – foreign 295 – 3 383 – 3
Total commercial 145,170 223 4,304 165,852 221 3,827
Residential mortgage 108,197 – 612 78,203 14 556
Home equity lines 23,236 – 66 22,107 – 80
Direct/Indirect consumer 31,068 56 30 30,317 67 27
Consumer finance 8,384 61 19 12,652 46 9
Credit card 29,461 502 – 27,186 475 –
Foreign consumer 1,971 – 6 2,092 – 7
Total consumer 202,317 619 733 172,557 602 679
Total managed loans and leases 347,487 $ 842 $ 5,037 338,409 $ 823 $ 4,506
Loans in revolving securitizations (4,732) (9,256)
Total held loans and leases $ 342,755 $329,153
Year Ended December 31, 2002 Year Ended December 31, 2001
Average Average
Loans and Loans and Loans and Loans and
Leases Leases Net Net Loss Leases Leases Net Net Loss
(Dollars in millions)
Outstanding Losses Ratio
(2)
Outstanding Losses Ratio
(2)
Commercial – domestic $ 110,073 $ 1,471 1.34% $135,750 $ 1,949 1.44%
Commercial – foreign 21,287 521 2.45 26,492 208 0.78
Commercial real estate – domestic 21,161 37 0.18 24,607 39 0.16
Commercial real estate – foreign 408 – – 348 – –
Total commercial 152,929 2,029 1.33 187,197 2,196 1.17
Residential mortgage 97,204 42 0.04 81,472 26 0.03
Home equity lines 22,807 26 0.11 22,013 19 0.09
Direct/Indirect consumer 30,264 210 0.69 30,374 250 0.82
Consumer finance 10,533 255 2.42 27,709 1,026 3.70
Credit card 27,352 1,443 5.28 24,637 1,174 4.76
Other consumer – domestic – 36 n/m – 50 n/m
Foreign consumer 2,021 5 0.25 2,222 5 0.22
Total consumer 190,181 2,017 1.06 188,427 2,550 1.35
Total managed loans and leases 343,110 $ 4,046 1.18% 375,624 $ 4,746 1.26%
Loans in revolving securitizations (6,291) (10,177)
Total held loans and leases $336,819 $365,447
n/m = not meaningful
(1) Excludes consumer real estate loans (which are placed on nonperforming status at 90 days past due).
(2) The net loss ratio is calculated by dividing managed loans and leases net losses by average managed loans and leases outstanding for each loan and lease category.
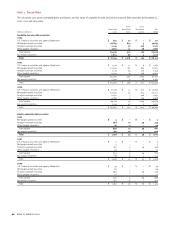
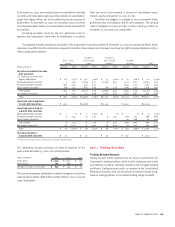
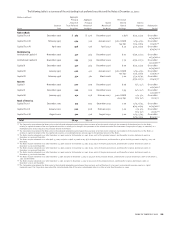
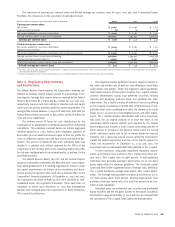
The Corporation reviews its loan and lease portfolio on a
managed basis. Managed loans and leases are defined as on-balance
sheet loans and leases as well as securitized credit card loans. New
advances under these previously securitized balances will be recorded
on the Corporation’s balance sheet after the revolving period of the
securitization, which has the effect of increasing loans on the
Corporation’s balance sheet and increasing net interest income and
charge-offs, with a corresponding reduction in noninterest income.
Portfolio balances, delinquency and historical loss amounts of the
managed loan and lease portfolio for 2002 and 2001 were as follows: