Bank of America 2002 Annual Report Download - page 33
Download and view the complete annual report
Please find page 33 of the 2002 Bank of America annual report below. You can navigate through the pages in the report by either clicking on the pages listed below, or by using the keyword search tool below to find specific information within the annual report.-
 1
1 -
2
-
3
-
4
-
5
-
6
-
7
-
8
-
9
-
10
-
11
-
12
-
13
-
14
-
15
-
16
-
17
-
18
-
19
-
20
-
21
-
22
-
 23
23 -
 24
24 -
 25
25 -
 26
26 -
 27
27 -
 28
28 -
 29
29 -
 30
30 -
 31
31 -
 32
32 -
 33
33 -
 34
34 -
 35
35 -
 36
36 -
 37
37 -
 38
38 -
 39
39 -
 40
40 -
 41
41 -
 42
42 -
 43
43 -
44
-
45
-
46
-
47
-
48
-
49
-
50
-
51
-
52
-
53
-
54
-
55
-
56
-
57
-
58
-
59
-
60
-
61
-
62
-
63
-
64
-
65
-
66
-
67
-
68
-
69
-
70
-
71
-
72
-
73
-
74
-
75
-
76
-
77
-
78
-
79
-
80
-
81
-
82
-
83
-
84
-
85
-
86
-
87
-
88
-
89
-
90
-
91
-
92
-
93
-
94
-
95
-
96
-
97
-
98
-
99
-
100
-
101
-
102
-
103
-
104
-
105
-
106
-
107
-
108
-
109
-
110
-
111
-
112
-
113
-
114
-
115
-
116
 |
 |

BANK OF AMERICA 2002 31
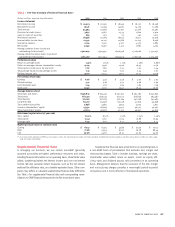
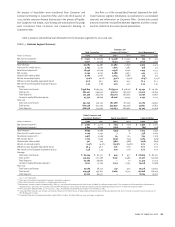
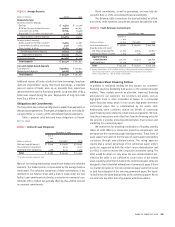
Table 3 presents selected financial information for the business segments for 2002 and 2001.
TABLE 3 Business Segment Summary
Consumer and
Total Corporation Commercial Banking
(1)
Asset Management
(1)
(Dollars in millions)
2002 2001 2002 2001 2002 2001
Net interest income(2) $ 21,511 $ 20,633 $ 14,538 $ 13,243 $774$ 742
Noninterest income(3) 13,571 14,348 8,451 7,815 1,625 1,733
Total revenue 35,082 34,981 22,989 21,058 2,399 2,475
Provision for credit losses 3,697 4,287 1,805 1,582 318 121
Noninterest expense(4) 18,436 20,709 11,558 11,410 1,473 1,537
Net income 9,249 6,792 6,088 4,953 404 522
Shareholder value added 3,760 3,087 4,054 3,286 113 312
Return on average equity 19.4% 14.0% 33.1% 25.9% 16.3% 23.5%
Efficiency ratio (taxable-equivalent basis) 52.6 59.2 50.3 54.2 61.4 62.1
Net interest yield (taxable-equivalent basis) 3.75 3.68 5.05 5.01 3.24 2.91
Average:
Total loans and leases $336,819 $365,447 $ 183,341 $ 178,116 $ 23,251 $ 24,381
Total assets 662,401 649,547 312,011 290,038 25,409 26,764
Total deposits 371,479 362,653 283,261 266,035 12,030 11,897
Common equity/Allocated equity 47,552 48,609 18,406 19,159 2,474 2,223
Year end:
Total loans and leases 342,755 329,153 187,068 182,158 22,263 24,692
Total assets 660,458 621,764 339,959 304,558 24,891 26,811
Total deposits 386,458 373,495 297,653 280,962 13,305 12,208
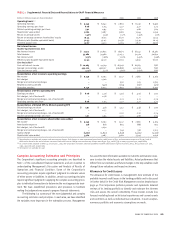
Global Corporate and
Investment Banking
(1)
Equity Investments
(1)
Corporate Other
(Dollars in millions)
2002 2001 2002 2001 2002 2001
Net interest income(2) $ 4,992 $ 4,727 $ (152) $ (150) $ 1,359 $ 2,071
Noninterest income(3) 3,841 4,859 (281) 179 (65) (238)
Total revenue 8,833 9,586 (433) 29 1,294 1,833
Provision for credit losses(5) 1,209 1,292 78358 1,284
Noninterest expense(4,5) 4,977 5,369 94 214 334 2,179
Net income (loss) 1,723 1,956 (329) (115) 1,363 (524)
Shareholder value added 421 519 (582) (388) (246) (642)
Return on average equity 15.5% 14.9% (15.5)% (4.9)% n/m n/m
Efficiency ratio (taxable-equivalent basis) 56.4 56.0 n/m n/m n/m n/m
Net interest yield (taxable-equivalent basis) 2.48 2.45 n/m n/m n/m n/m
Average:
Total loans and leases $ 62,934 $ 82,321 $ 440 $ 477 $ 66,853 $ 80,152
Total assets 241,325 232,366 6,179 6,583 77,477 93,796
Total deposits 64,769 66,983 –13 11,419 17,725
Common equity/Allocated equity(6) 11,121 13,164 2,123 2,365 13,428 11,698
Year end:
Total loans and leases 57,569 68,215 437 433 75,418 53,655
Total assets 219,938 195,817 6,064 6,315 69,606 88,263
Total deposits 67,216 66,532 ––8,284 13,793
n/m = not meaningful
(1) There were no material intersegment revenues among the segments.
(2) Net interest income is presented on a taxable-equivalent basis.
(3) Noninterest income in 2001 included the $83 SFAS 133 transition adjustment net loss which was included in trading account profits. The components of the transition adjustment by
segment were a gain of $4 for Consumer and Commercial Banking, a gain of $19 for Global Corporate and Investment Banking and a loss of $106 for Corporate Other.
(4) The Corporation adopted SFAS 142 on January 1, 2002. Accordingly, no goodwill amortization was recorded in 2002.
(5) Corporate Other includes exit charges consisting of provision for credit losses of $395 and noninterest expense of $1,305 related to the exit of certain consumer finance businesses in
the third quarter of 2001.
(6) Corporate Other also included unallocated capital of $12.5 billion and $9.4 billion in 2002 and 2001, respectively.
the process of liquidation were transferred from Consumer and
Commercial Banking to Corporate Other, and in the third quarter of
2001, certain consumer finance businesses in the process of liquida-
tion (subprime real estate, auto leasing and manufactured housing)
were transferred from Consumer and Commercial Banking to
Corporate Other.
See Note 20 of the consolidated financial statements for addi-
tional business segment information, reconciliations to consolidated
amounts and information on Corporate Other. Certain prior period
amounts have been reclassified between segments and their compo-
nents to conform to the current period presentation.