Bank of America 2002 Annual Report Download - page 74
Download and view the complete annual report
Please find page 74 of the 2002 Bank of America annual report below. You can navigate through the pages in the report by either clicking on the pages listed below, or by using the keyword search tool below to find specific information within the annual report.-
 1
1 -
2
-
3
-
4
-
5
-
6
-
7
-
8
-
9
-
10
-
11
-
12
-
13
-
14
-
15
-
16
-
17
-
18
-
19
-
20
-
21
-
22
-
23
-
24
-
25
-
26
-
27
-
28
-
29
-
30
-
31
-
32
-
33
-
34
-
35
-
36
-
37
-
38
-
39
-
40
-
41
-
42
-
43
-
44
-
45
-
46
-
47
-
48
-
49
-
50
-
51
-
52
-
53
-
54
-
55
-
56
-
57
-
58
-
59
-
60
-
61
-
62
-
63
-
 64
64 -
 65
65 -
 66
66 -
 67
67 -
 68
68 -
 69
69 -
 70
70 -
 71
71 -
 72
72 -
 73
73 -
 74
74 -
 75
75 -
 76
76 -
 77
77 -
 78
78 -
 79
79 -
 80
80 -
 81
81 -
 82
82 -
 83
83 -
 84
84 -
85
-
86
-
87
-
88
-
89
-
90
-
91
-
92
-
93
-
94
-
95
-
96
-
97
-
98
-
99
-
100
-
101
-
102
-
103
-
104
-
105
-
106
-
107
-
108
-
109
-
110
-
111
-
112
-
113
-
114
-
115
-
116
 |
 |

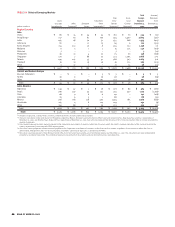
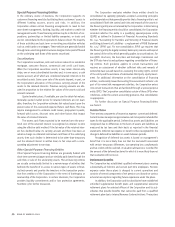
Consolidated Statement of Income
Bank of America Corporation and Subsidiaries
72 BANK OF AMERICA 200272 BANK OF AMERICA 200272 BANK OF AMERICA 200272 BANK OF AMERICA 2002
Year Ended December 31
(Dollars in millions, except per share information)
2002 2001 2000
Interest income
Interest and fees on loans and leases $ 22,030 $ 27,279 $ 31,869
Interest and dividends on securities 4,035 3,706 4,976
Federal funds sold and securities purchased under agreements to resell 870 1,414 2,354
Trading account assets 3,811 3,623 2,725
Other interest income 1,415 2,271 1,241
Total interest income 32,161 38,293 43,165
Interest expense
Deposits 5,434 8,886 11,007
Short-term borrowings 2,089 4,167 7,957
Trading account liabilities 1,260 1,155 892
Long-term debt 2,455 3,795 4,960
Total interest expense 11,238 18,003 24,816
Net interest income 20,923 20,290 18,349
Noninterest income
Consumer service charges 2,986 2,865 2,654
Corporate service charges 2,290 2,078 1,889
Total service charges 5,276 4,943 4,543
Consumer investment and brokerage services 1,544 1,546 1,466
Corporate investment and brokerage services 693 566 463
Total investment and brokerage services 2,237 2,112 1,929
Mortgage banking income 751 593 512
Investment banking income 1,545 1,579 1,512
Equity investment gains (losses) (280) 291 1,054
Card income 2,620 2,422 2,229
Trading account profits 778 1,842 1,923
Other income 644 566 880
Total noninterest income 13,571 14,348 14,582
Total revenue 34,494 34,638 32,931
Provision for credit losses 3,697 4,287 2,535
Gains on sales of securities 630 475 25
Noninterest expense
Personnel 9,682 9,829 9,400
Occupancy 1,780 1,774 1,682
Equipment 1,124 1,115 1,173
Marketing 753 682 621
Professional fees 525 564 452
Amortization of intangibles 218 878 864
Data processing 1,017 776 667
Telecommunications 481 484 527
Other general operating 2,856 3,302 2,697
Business exit costs –1,305 –
Restructuring charges –– 550
Total noninterest expense 18,436 20,709 18,633
Income before income taxes 12,991 10,117 11,788
Income tax expense 3,742 3,325 4,271
Net income $ 9,249 $ 6,792 $ 7,517
Net income available to common shareholders $ 9,244 $ 6,787 $ 7,511
Per common share information
Earnings $6.08 $ 4.26 $ 4.56
Diluted earnings $ 5.91 $ 4.18 $ 4.52
Dividends $2.44 $ 2.28 $ 2.06
Average common shares issued and outstanding (in thousands) 1,520,042 1,594,957 1,646,398
See accompanying notes to consolidated financial statements.