Bank of America 2002 Annual Report Download - page 113
Download and view the complete annual report
Please find page 113 of the 2002 Bank of America annual report below. You can navigate through the pages in the report by either clicking on the pages listed below, or by using the keyword search tool below to find specific information within the annual report.-
 1
1 -
2
-
3
-
4
-
5
-
6
-
7
-
8
-
9
-
10
-
11
-
12
-
13
-
14
-
15
-
16
-
17
-
18
-
19
-
20
-
21
-
22
-
23
-
24
-
25
-
26
-
27
-
28
-
29
-
30
-
31
-
32
-
33
-
34
-
35
-
36
-
37
-
38
-
39
-
40
-
41
-
42
-
43
-
44
-
45
-
46
-
47
-
48
-
49
-
50
-
51
-
52
-
53
-
54
-
55
-
56
-
57
-
58
-
59
-
60
-
61
-
62
-
63
-
64
-
65
-
66
-
67
-
68
-
69
-
70
-
71
-
72
-
73
-
74
-
75
-
76
-
77
-
78
-
79
-
80
-
81
-
82
-
83
-
84
-
85
-
86
-
87
-
88
-
89
-
90
-
91
-
92
-
93
-
94
-
95
-
96
-
97
-
98
-
99
-
100
-
101
-
102
-
 103
103 -
 104
104 -
 105
105 -
 106
106 -
 107
107 -
 108
108 -
 109
109 -
 110
110 -
 111
111 -
 112
112 -
 113
113 -
 114
114 -
 115
115 -
 116
116
 |
 |

BANK OF AMERICA 2002 111
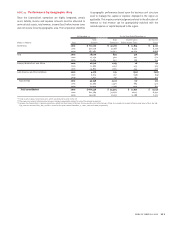
NOTE 22 Performance by Geographic Area
Since the Corporation’s operations are highly integrated, certain
asset, liability, income and expense amounts must be allocated to
arrive at total assets, total revenue, income (loss) before income taxes
and net income (loss) by geographic area. The Corporation identifies
its geographic performance based upon the business unit structure
used to manage the capital or expense deployed in the region as
applicable. This requires certain judgments related to the allocation of
revenue so that revenue can be appropriately matched with the
related expense or capital deployed in the region.
At December 31 For the Year Ended December 31
■■■■■■■■■■■■■■■■■■■
Total Total Income (Loss) Net Income
(Dollars in millions)
Year Assets
(1)
Revenue
(2)
before Income Taxes (Loss)
Domestic(3) 2002 $ 611,100 $ 32,267 $ 12,874 $ 9,127
2001 570,179 32,168 9,433 6,319
2000 587,281 30,623 10,574 6,686
Asia 2002 18,566 839 410 278
2001 17,230 920 407 272
2000 22,094 952 506 354
Europe, Middle East and Africa 2002 26,716 1,163 28 42
2001 27,680 1,243 435 295
2000 25,803 1,005 544 370
Latin America and the Caribbean 2002 4,076 225 (321) (198)
2001 6,675 307 (158) (94)
2000 7,013 351 164 107
Total foreign 2002 49,358 2,227 117 122
2001 51,585 2,470 684 473
2000 54,910 2,308 1,214 831
Total consolidated 2002 $ 660,458 $ 34,494 $ 12,991 $ 9,249
2001 621,764 34,638 10,117 6,792
2000 642,191 32,931 11,788 7,517
(1) Total assets includes long-lived assets, which are primarily located in the U.S.
(2) There were no material intercompany revenues between geographic regions for any of the periods presented.
(3) Includes the Corporation’s Canadian operations, which had total assets of $2,666, $2,849 and $3,938; total revenues of $96, $121 and $118; income before income taxes of $111, $4 and
$34; and net income of $83, $0.3 and $22 at and for the years ended December 31, 2002, 2001 and 2000, respectively.