Bank of America 2002 Annual Report Download - page 57
Download and view the complete annual report
Please find page 57 of the 2002 Bank of America annual report below. You can navigate through the pages in the report by either clicking on the pages listed below, or by using the keyword search tool below to find specific information within the annual report.-
 1
1 -
2
-
3
-
4
-
5
-
6
-
7
-
8
-
9
-
10
-
11
-
12
-
13
-
14
-
15
-
16
-
17
-
18
-
19
-
20
-
21
-
22
-
23
-
24
-
25
-
26
-
27
-
28
-
29
-
30
-
31
-
32
-
33
-
34
-
35
-
36
-
37
-
38
-
39
-
40
-
41
-
42
-
43
-
44
-
45
-
46
-
 47
47 -
 48
48 -
 49
49 -
 50
50 -
 51
51 -
 52
52 -
 53
53 -
 54
54 -
 55
55 -
 56
56 -
 57
57 -
 58
58 -
 59
59 -
 60
60 -
 61
61 -
 62
62 -
 63
63 -
 64
64 -
 65
65 -
 66
66 -
 67
67 -
68
-
69
-
70
-
71
-
72
-
73
-
74
-
75
-
76
-
77
-
78
-
79
-
80
-
81
-
82
-
83
-
84
-
85
-
86
-
87
-
88
-
89
-
90
-
91
-
92
-
93
-
94
-
95
-
96
-
97
-
98
-
99
-
100
-
101
-
102
-
103
-
104
-
105
-
106
-
107
-
108
-
109
-
110
-
111
-
112
-
113
-
114
-
115
-
116
 |
 |

BANK OF AMERICA 2002 55
Noninterest expense increased $2.1 billion, primarily driven by
business exit costs of $1.30 billion in 2001, higher personnel, litiga-
tion, professional fees, data processing and marketing expenses, par-
tially offset by the restructuring charge in 2000. Higher personnel
expense was driven by a $150 million severance charge in the fourth
quarter of 2001 related to ongoing efficiency improvement programs,
higher revenue-related incentive compensation and increased salaries
expense. The Corporation recorded $334 million in litigation expense in
the fourth quarter of 2001 related to small settlements and an addi-
tion to the legal reserve to cover increased exposure to existing litiga-
tion. Higher professional fees reflected the increase in initiatives
related to the Corporation’s strategy to improve customer satisfaction,
the launch of a company-wide Six Sigma quality and productivity
program and implementation of a new integrated planning process.
A tax benefit of $418 million, generated as a result of the
Corporation’s realignment of certain problem loan management activ-
ities into a wholly-owned subsidiary (SSI), resulted in a 17 percent
effective tax rate for the fourth quarter of 2001. The effective tax rates
for 2001 and 2000 were 32.9 percent and 36.2 percent, respectively.
For additional information on SSI, see “Problem Loan Management”
beginning on page 48.
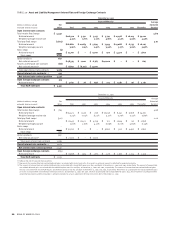
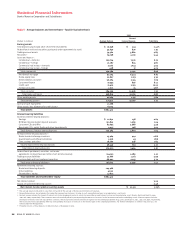
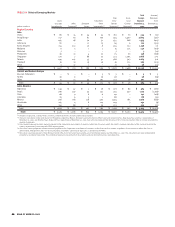
Business Segment Operations
Consumer and Commercial Banking
Total revenue increased $1.6 billion, or eight percent, in 2001 com-
pared to 2000. Net interest income increased $856 million, or seven
percent, due to a favorable shift in loan mix, overall loan and deposit
growth and the Corporation’s treasury asset and liability activities.
This increase was partially offset by the impact of the money market
deposit pricing initiative as the Corporation offered more com-
petitive
money market savings rates. Noninterest income increased
$736 million, or 10 percent, driven by a nine percent increase in
service charges, a nine percent increase in card income and strong
mortgage banking revenue. Net income in 2001 rose $478 million,
or 11 percent, due to the increases in net interest income and non-
interest income discussed above, partially offset by an increase in
the provision for credit losses and a four percent increase in non-
interest expense. The provision for credit losses increased $551 mil-
lion, or 53 percent, reflecting higher charge-offs in the commercial
and credit card loan portfolios.
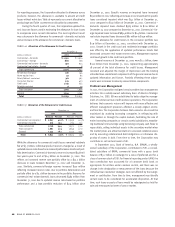
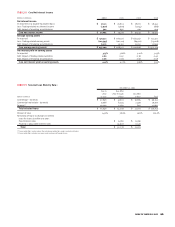
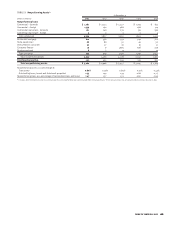
Asset Management
Total revenue remained flat at $2.5 billion in 2001, as the increase in
net interest income was offset by a decline in noninterest income.
Net interest income increased $78 million, or 12 percent, due to the
Corporation’s treasury asset and liability activities and growth in the
commercial and residential mortgage loan portfolios. Noninterest
income decreased $68 million, or four percent, as a decline in other
income was partially offset by an increase in investment and broker-
age services income. The increase in investment and brokerage serv-
ices income was due to new asset management business and the
completed acquisition of Marsico, partially offset by lower broker
activity due to decreased trade volume. Net income decreased $66 mil-
lion, or 11 percent, in 2001, primarily due to a $74 million increase in pro-
vision expense largely related to one loan that was charged off in the
second quarter of 2001 and increased noninterest expense.
Noninterest expense increased $75 million, or five percent, reflecting
investments in new private banking offices, the acquisition of Marsico
and personnel supporting the revenue growth initiatives, partially
offset by one-time business divestiture expenditures in 2000. Assets
under management increased $36.1 billion, or 13 percent, primarily
driven by the growth in money market funds and the addition of the
remaining Marsico Funds.
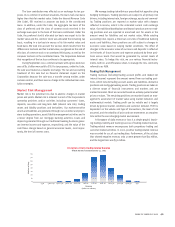
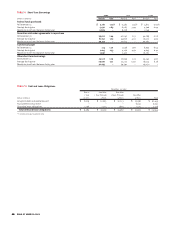
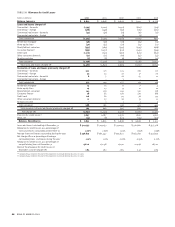
Global Corporate and Investment Banking
In 2001, total revenue increased $1.1 billion, or 14 percent, primarily due
to $663 million, or 24 percent, growth in trading-related revenue. Net
interest income increased $912 million, or 24 percent, as a result of
higher trading-related activities and the Corporation’s treasury asset
and liability activities, partially offset by lower commercial loan levels.
Noninterest income increased $230 million, or five percent, as increases
in investment and brokerage services, corporate service charges, trad-
ing account profits and investment banking income were partially offset
by a decline in other income. Net income increased $133 million, or
seven percent, in 2001 as revenue growth was partially offset by higher
credit-related costs and noninterest expense. The provision for credit
losses increased $540 million to $1.3 billion due to credit quality deteri-
oration in the commercial –
domestic loan portfolio of Global Credit
Products. A $373 million, or seven percent, increase in noninterest
expense was primarily due to higher market-related incentives and
other expenses in line with revenue growth.
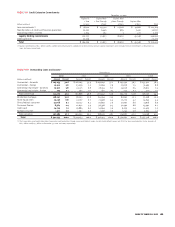
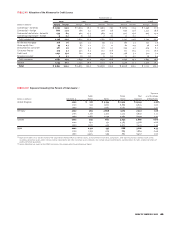
Equity Investments
In 2001, both revenue and net income decreased substantially primarily
due to lower equity investment gains. Equity investment gains
decreased $753 million to $240 million. Principal Investing recorded
cash gains of $425 million, offset by impairment charges of $335 mil-
lion and fair value adjustment losses of $40 million. Equity investment
gains in the strategic investments portfolio included $140 million in
the first quarter of 2001 related to the sale of an interest in the Star
Systems ATM network.