Bank of America 2002 Annual Report Download - page 52
Download and view the complete annual report
Please find page 52 of the 2002 Bank of America annual report below. You can navigate through the pages in the report by either clicking on the pages listed below, or by using the keyword search tool below to find specific information within the annual report.-
 1
1 -
2
-
3
-
4
-
5
-
6
-
7
-
8
-
9
-
10
-
11
-
12
-
13
-
14
-
15
-
16
-
17
-
18
-
19
-
20
-
21
-
22
-
23
-
24
-
25
-
26
-
27
-
28
-
29
-
30
-
31
-
32
-
33
-
34
-
35
-
36
-
37
-
38
-
39
-
40
-
41
-
 42
42 -
 43
43 -
 44
44 -
 45
45 -
 46
46 -
 47
47 -
 48
48 -
 49
49 -
 50
50 -
 51
51 -
 52
52 -
 53
53 -
 54
54 -
 55
55 -
 56
56 -
 57
57 -
 58
58 -
 59
59 -
 60
60 -
 61
61 -
 62
62 -
63
-
64
-
65
-
66
-
67
-
68
-
69
-
70
-
71
-
72
-
73
-
74
-
75
-
76
-
77
-
78
-
79
-
80
-
81
-
82
-
83
-
84
-
85
-
86
-
87
-
88
-
89
-
90
-
91
-
92
-
93
-
94
-
95
-
96
-
97
-
98
-
99
-
100
-
101
-
102
-
103
-
104
-
105
-
106
-
107
-
108
-
109
-
110
-
111
-
112
-
113
-
114
-
115
-
116
 |
 |

50 BANK OF AMERICA 2002
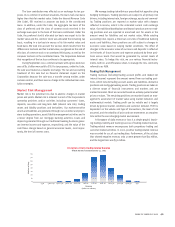
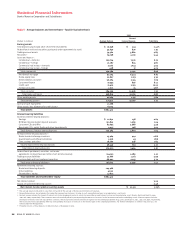
During the fourth quarter of 2002, we completed an enhancement of
our methodology used in the VAR risk aggregation calculation. This
approach utilizes historical market conditions over the last three
years to derive estimates of trading risk and provides for the natural
aggregation of trading risk across different groups. Historically, we
used a mathematical method to allocate risk across different trading
groups that did not assume the benefit of correlation across markets.
This change resulted in a lower VAR calculation in 2002. Prior year
VAR amounts have not been restated to reflect this change.
Stress Testing
Because the very nature of a VAR model suggests results can exceed
our estimates, we “stress test” our portfolio. Stress testing estimates
the value change in our trading portfolio due to abnormal market
movements. Various stress scenarios are run regularly against the
trading portfolio to verify that, even under extreme market moves, the
Corporation will preserve its capital; to determine the effects of signifi-
cant historical or hypothetical events; and to determine the effects of
specific, extreme hypothetical, but plausible events. The results of the
stress scenarios are calculated daily and reported to senior manage-
ment as part of the regular reporting process. The results of certain
specific, extreme hypothetical scenarios are presented to ALCO peri-
odically. Examples of these specific stress scenarios include calculat-
ing the effects on the overall portfolio of an extreme Federal Reserve
Board tightening or easing of interest rates, the effects of a prolonged
conflict in the Middle East and a recession in Japan and its correspon-
ding ripple effects globally.
In addition, for interest rate sensitive products and portfolios, we
gauge the interest rate sensitivity through the use of a DV01 (Dollar
Value of One Basis Point) method, which computes the impact of a one
basis point (or 1/100 or 0.01 percent) movement in interest rates. The
calculations are done on individual portfolios and at the aggregate
level. This method is a useful tool for risk management, particularly at
the individual trader level, but must be complemented with other tools.
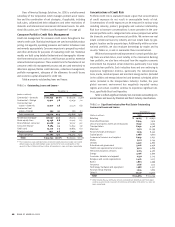
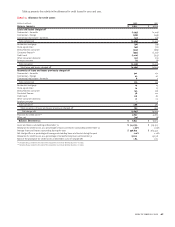
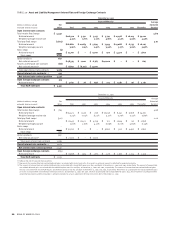
Table 18 presents actual daily VAR for both 2002 and 2001.
TABLE 18 Trading Activities Market Risk
2002 2001
Average High Low Average High Low
(Dollars in millions)
VAR
(1)
VAR
(2)
VAR
(2)
VAR
(1)
VAR
(2)
VAR
(2)
Foreign exchange $ 3.2 $ 7.1 $ 0.5 $ 7.2 $ 12.8 $ 1.9
Interest rate 28.8 40.3 17.3 34.3 47.0 23.0
Credit(3) 14.8 21.6 6.5 10.9 17.3 3.0
Real estate/mortgage(4) 19.2 61.6 2.5 33.2 55.5 8.8
Equities 8.8 18.2 4.3 15.4 25.1 8.9
Commodities 9.2 15.4 3.4 4.3 10.9 0.9
Total trading portfolio 40.1 69.8 19.2 52.7 69.9 35.8
(1) The average VAR for the total portfolio is less than the sum of the VARs of the individual portfolios due to risk offsets arising from the diversification of the portfolio.
(2) The high and low for the total portfolio may not equal the sum of the individual components as the highs or lows of the individual portfolios may have occurred on different trading days.
(3) Credit includes credit fixed income, credit derivatives, hedges of credit exposure and mortgage banking assets.
(4) Real estate/mortgage, which is included in the credit category in the Trading-Related Revenue table in Note 4 of the consolidated financial statements, includes capital market real
estate and mortgage banking certificates.
To evaluate risk in our trading activities, we focus on the actual and
potential volatility of individual positions as well as portfolios. At a
portfolio and corporate level, we use Value at Risk (VAR) modeling and
stress testing. VAR is a key limit used to measure market risk. Trader lim-
its and VAR are used to manage day-to-day risks and are subject to test-
ing where we compare expected performance to actual performance.
This testing provides us a real life view of our models’ predictive accu-
racy. All limit excesses are communicated to senior management.
A VAR model estimates a range of hypothetical scenarios within
which the next day’s profit or loss is expected. These estimates are
impacted by the nature of the positions in the portfolio and the cor-
relation within the portfolio. Within any VAR model, there are
significant and numerous assumptions that will differ from company
to company. Our VAR model assumes a 99 percent confidence level.
Statistically this means that over a three to five year period, one out of
100 trading days, or on average, two to three times a year, losses will
exceed the model-calculated range. Actual losses did not exceed VAR
in 2002 or 2000 but exceeded it once in 2001.
There are numerous assumptions and estimates associated
with modeling, and actual results could differ. In addition to the
review of our assumptions with senior management, we mitigate
these uncertainties through close monitoring and by examining and
updating assumptions on an ongoing basis. If the results of our
analysis indicate higher than expected levels of risk, proactive meas-
ures are taken to adjust risk levels.