Bank of America 2002 Annual Report Download - page 47
Download and view the complete annual report
Please find page 47 of the 2002 Bank of America annual report below. You can navigate through the pages in the report by either clicking on the pages listed below, or by using the keyword search tool below to find specific information within the annual report.-
 1
1 -
2
-
3
-
4
-
5
-
6
-
7
-
8
-
9
-
10
-
11
-
12
-
13
-
14
-
15
-
16
-
17
-
18
-
19
-
20
-
21
-
22
-
23
-
24
-
25
-
26
-
27
-
28
-
29
-
30
-
31
-
32
-
33
-
34
-
35
-
36
-
 37
37 -
 38
38 -
 39
39 -
 40
40 -
 41
41 -
 42
42 -
 43
43 -
 44
44 -
 45
45 -
 46
46 -
 47
47 -
 48
48 -
 49
49 -
 50
50 -
 51
51 -
 52
52 -
 53
53 -
 54
54 -
 55
55 -
 56
56 -
 57
57 -
58
-
59
-
60
-
61
-
62
-
63
-
64
-
65
-
66
-
67
-
68
-
69
-
70
-
71
-
72
-
73
-
74
-
75
-
76
-
77
-
78
-
79
-
80
-
81
-
82
-
83
-
84
-
85
-
86
-
87
-
88
-
89
-
90
-
91
-
92
-
93
-
94
-
95
-
96
-
97
-
98
-
99
-
100
-
101
-
102
-
103
-
104
-
105
-
106
-
107
-
108
-
109
-
110
-
111
-
112
-
113
-
114
-
115
-
116
 |
 |

BANK OF AMERICA 2002 45
Commercial – domestic loans past due 90 days or more and still
interest were $223 million and $215 million at December 31, 2002 and
2001, respectively. Consumer loans past due 90 days or more and still
accruing interest were $541 million and $459 million at December 31,
2002 and 2001, respectively.
As a matter of corporate practice, we do not discuss specific client
relationships; however, due to the publicity and interest surrounding
Enron Corporation and its related entities (Enron), we made an excep-
tion. In the fourth quarter of 2001, our total exposure to Enron was
$503 million before a charge-off of $210 million, as well as a $21 million
write-off of Enron securities related to a collateralized loan obligation.
During 2002, the Corporation had an additional $48 million of charge-
offs related to Enron. The Corporation’s exposure (after charge-offs)
related to Enron was $185 million and $272 million at December 31,
2002 and 2001, respectively, of which $136 million and $184 million
was secured. Nonperforming loans related to Enron were $159 million
and $226 million at December 31, 2002 and 2001, respectively.
The Corporation also has other assets that represent possible
credit risk. Included in Other Assets are loans held for sale and lever-
aged lease partnership interests of $13.8 billion and $387 million,
respectively, at December 31, 2002 and $8.4 billion and $485 million,
respectively, at December 31, 2001. Included in these balances are
nonperforming loans held for sale and leveraged lease partnership
interests of $118 million and $2 million, respectively, at December 31,
2002 and $1.0 billion and $0, respectively, at December 31, 2001.
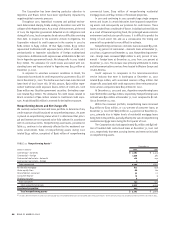
The Corporation utilizes actual loan net charge-offs in its analysis
of the adequacy of the allowance for credit losses. Net charge-offs are
presented in Table 15.
Commercial – domestic loan net charge-offs decreased $478 mil-
lion in 2002 compared to 2001, primarily due to lower domestic gross
charge-offs in Global Corporate and Investment Banking and Commercial
Banking and higher recoveries, partially offset by charge-offs related to
one large credit in the Private Bank.
Commercial – foreign loan net charge-offs increased $313 million
in 2002 compared to 2001, primarily due to charge-offs in emerging
markets including Argentina, as well as in telecommunications serv-
ices, media, and utilities industries in Western Europe.
Net charge-offs on consumer finance loans decreased $771 mil-
lion in 2002 compared to 2001, primarily due to $635 million in exit-
related charge-offs in the third quarter of 2001 as well as continued
runoff in the portfolio.
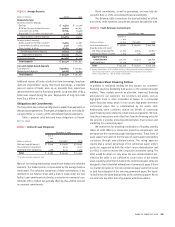
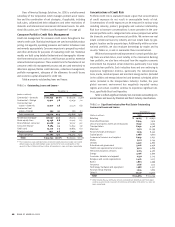
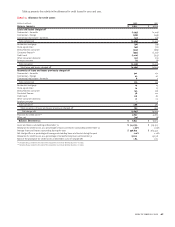
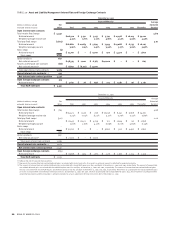
Table 14 presents the additions to and reductions in nonperforming assets in the commercial and consumer portfolios during 2002 and 2001.
TABLE 14 Nonperforming Assets Activity
(Dollars in millions)
2002 2001
Balance, January 1 $ 4,908 $ 5,457
Commercial
Additions to nonperforming assets:
New nonaccrual loans and foreclosed properties 4,963 4,797
Advances on loans 244 197
Total commercial additions 5,207 4,994
Reductions in nonperforming assets:
Paydowns, payoffs and sales (2,171) (2,065)
Returns to performing status (149) (313)
Charge-offs(1) (2,354) (2,289)
Total commercial reductions (4,674) (4,667)
Total commercial net additions to nonperforming assets 533 327
Consumer
Additions to nonperforming assets:
New nonaccrual loans and foreclosed properties 1,694 2,723
Total consumer additions 1,694 2,723
Reductions in nonperforming assets:
Paydowns, payoffs and sales (957) (881)
Returns to performing status (886) (1,360)
Charge-offs(1) (107) (261)
Transfers (to) from assets held for sale(2,3) 77 (1,097)
Total consumer reductions (1,873) (3,599)
Total consumer net reductions in nonperforming assets (179) (876)
Total net additions to (reductions in) nonperforming assets 354 (549)
Balance, December 31 $ 5,262 $ 4,908
(1) Certain loan products, including commercial credit card, consumer credit card and consumer non-real estate loans, are not classified as nonperforming; therefore, the charge-offs on
these loans are not included above.
(2) Includes assets held for sale that were foreclosed and transferred to foreclosed properties.
(3) Transfers in 2001 were primarily related to the exit of the subprime real estate lending business.
Commercial – domestic loans past due 90 days or more and still accruing