Bank of America 2002 Annual Report Download - page 44
Download and view the complete annual report
Please find page 44 of the 2002 Bank of America annual report below. You can navigate through the pages in the report by either clicking on the pages listed below, or by using the keyword search tool below to find specific information within the annual report.-
 1
1 -
2
-
3
-
4
-
5
-
6
-
7
-
8
-
9
-
10
-
11
-
12
-
13
-
14
-
15
-
16
-
17
-
18
-
19
-
20
-
21
-
22
-
23
-
24
-
25
-
26
-
27
-
28
-
29
-
30
-
31
-
32
-
33
-
 34
34 -
 35
35 -
 36
36 -
 37
37 -
 38
38 -
 39
39 -
 40
40 -
 41
41 -
 42
42 -
 43
43 -
 44
44 -
 45
45 -
 46
46 -
 47
47 -
 48
48 -
 49
49 -
 50
50 -
 51
51 -
 52
52 -
 53
53 -
 54
54 -
55
-
56
-
57
-
58
-
59
-
60
-
61
-
62
-
63
-
64
-
65
-
66
-
67
-
68
-
69
-
70
-
71
-
72
-
73
-
74
-
75
-
76
-
77
-
78
-
79
-
80
-
81
-
82
-
83
-
84
-
85
-
86
-
87
-
88
-
89
-
90
-
91
-
92
-
93
-
94
-
95
-
96
-
97
-
98
-
99
-
100
-
101
-
102
-
103
-
104
-
105
-
106
-
107
-
108
-
109
-
110
-
111
-
112
-
113
-
114
-
115
-
116
 |
 |

42 BANK OF AMERICA 2002
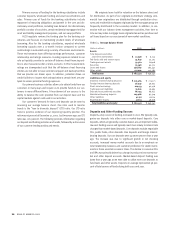
Banc of America Strategic Solutions, Inc. (SSI) is a wholly-owned
subsidiary of the Corporation which manages problem asset resolu-
tion and the coordination of exit strategies, if applicable, including
bulk sales, collateralized debt obligations and other resolutions of
domestic and international commercial distressed assets. For addi-
tional discussion, see “Problem Loan Management” on page 48.
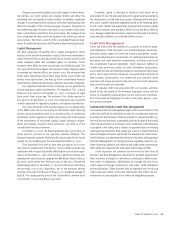
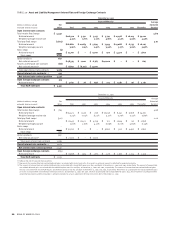
Consumer Portfolio Credit Risk Management
Credit risk management for consumer credit occurs throughout a bor-
rower’s credit cycle. Statistical techniques are used to establish product
pricing, risk appetite, operating processes and metrics to balance risks
and rewards appropriately. Consumer exposure is grouped by product
and other attributes for purposes of evaluating credit risk. Statistical
models are built using detailed behavioral and demographic informa-
tion from external sources such as credit bureaus as well as extensive
internal historical experience. These models form the foundation of our
consumer credit risk management process and are used extensively to
determine approve/decline credit decisions, collections management,
portfolio management, adequacy of the allowance for credit losses
and economic capital allocation for credit risk.
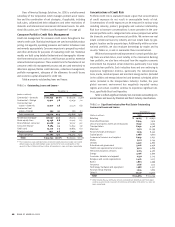
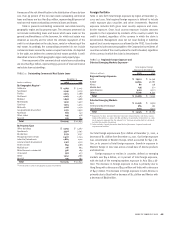
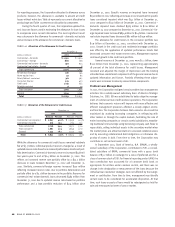
Table 9 presents outstanding loans and leases.
TABLE 9 Outstanding Loans and Leases(1)
December 31
(Dollars in millions)
2002 2001
Commercial – domestic $ 105,053 30.6% $ 118,205 35.9%
Commercial – foreign 19,912 5.8 23,039 7.0
Commercial real
estate – domestic 19,910 5.8 22,271 6.8
Commercial real
estate – foreign 295 0.1 383 0.1
Total commercial 145,170 42.3 163,898 49.8
Residential mortgage 108,197 31.6 78,203 23.8
Home equity lines 23,236 6.8 22,107 6.7
Direct/Indirect consumer 31,068 9.1 30,317 9.2
Consumer finance 8,384 2.4 12,652 3.9
Credit card 24,729 7.2 19,884 6.0
Foreign consumer 1,971 0.6 2,092 0.6
Total consumer 197,585 57.7 165,255 50.2
Total $ 342,755 100.0% $329,153 100.0%
(1) The Corporation used credit derivatives to provide credit protection (single name credit
default swaps, basket credit default swaps and CLOs) for loan counterparties in the
amounts of $16.7 billion and $14.5 billion at December 31, 2002 and 2001, respectively.
Concentrations of Credit Risk
Portfolio credit risk is evaluated toward a goal that concentrations
of credit exposure do not result in unacceptable levels of risk.
Concentrations of credit exposure can be measured in various ways
including industry, product, geography and customer relationship.
Risk due to borrower concentrations is more prevalent in the com-
mercial portfolio and is categorized into various perspectives within
the domestic and foreign commercial portfolio. We review non-real
estate commercial loans by industry and real estate loans by geo-
graphic location and by property type. Additionally, within our inter-
national portfolio, we also evaluate borrowings by region and by
country. Tables 10, 11 and 12 summarize these concentrations.
While we have experienced improvement in certain portfolios dur-
ing these uncertain times, most notably in the Commercial Banking
loan portfolio, we also have witnessed how the negative economic
environment has impacted certain industries, particularly in our large
corporate loan portfolio. Such industries have and are continuing to
experience heightened distress, particularly the telecommunica-
tions, media, merchant power
and merchant energy sectors (included
in the utilities and energy industries)
and domestic scheduled airline
sector (included in the transportation industry). Further, the poor
global economic environment has negatively impacted various
regions and certain countries continue to experience significant dis-
tress, specifically Brazil and Argentina.
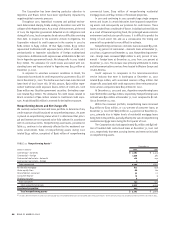
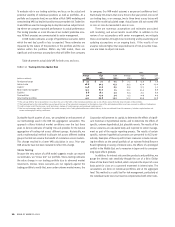
Table 10 reflects significant industry non-real estate outstanding com-
mercial loans and leases by Standard and Poor’s industry classifications.
TABLE 10 Significant Industry Non-Real Estate Outstanding
Commercial Loans and Leases
December 31
(Dollars in millions)
2002 2001
Retailing $ 10,165 $ 10,651
Diversified financials 8,344 7,916
Leisure and sports, hotels and restaurants 8,139 9,193
Transportation 8,030 9,508
Materials 7,972 10,399
Food, beverage and tobacco 7,335 8,543
Capital goods 7,088 9,691
Commercial services and supplies 6,449 7,637
Media 5,911 5,244
Utilities 5,590 4,860
Education and government 5,206 4,936
Health care equipment and services 3,912 4,809
Telecommunications services 3,105 4,560
Energy 3,076 3,800
Consumer durables and apparel 2,591 3,725
Religious and social organizations 2,426 2,213
Banks 1,881 2,999
Insurance 1,616 2,113
Technology hardware and equipment 1,368 2,527
Food and drug retailing 1,344 1,603
Other(1) 23,417 24,317
Total $ 124,965 $ 141,244
(1) Other includes $5,134 and $6,032 of loans outstanding to Individuals and Trusts repre-
senting 1.5 percent and 1.8 percent of total loans outstanding at December 31, 2002 and
2001, respectively.