Bank of America 2002 Annual Report Download - page 111
Download and view the complete annual report
Please find page 111 of the 2002 Bank of America annual report below. You can navigate through the pages in the report by either clicking on the pages listed below, or by using the keyword search tool below to find specific information within the annual report.-
 1
1 -
2
-
3
-
4
-
5
-
6
-
7
-
8
-
9
-
10
-
11
-
12
-
13
-
14
-
15
-
16
-
17
-
18
-
19
-
20
-
21
-
22
-
23
-
24
-
25
-
26
-
27
-
28
-
29
-
30
-
31
-
32
-
33
-
34
-
35
-
36
-
37
-
38
-
39
-
40
-
41
-
42
-
43
-
44
-
45
-
46
-
47
-
48
-
49
-
50
-
51
-
52
-
53
-
54
-
55
-
56
-
57
-
58
-
59
-
60
-
61
-
62
-
63
-
64
-
65
-
66
-
67
-
68
-
69
-
70
-
71
-
72
-
73
-
74
-
75
-
76
-
77
-
78
-
79
-
80
-
81
-
82
-
83
-
84
-
85
-
86
-
87
-
88
-
89
-
90
-
91
-
92
-
93
-
94
-
95
-
96
-
97
-
98
-
99
-
100
-
 101
101 -
 102
102 -
 103
103 -
 104
104 -
 105
105 -
 106
106 -
 107
107 -
 108
108 -
 109
109 -
 110
110 -
 111
111 -
 112
112 -
 113
113 -
 114
114 -
 115
115 -
 116
116
 |
 |

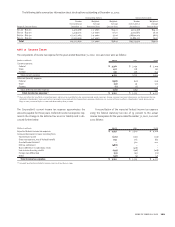
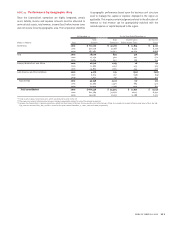
Reconciliations of the four business segments’ revenue, net income and assets to consolidated totals follow:
(Dollars in millions)
2002 2001 2000
Segments’ revenue $ 33,788 $ 33,148 $ 31,245
Adjustments:
Earnings associated with unassigned capital 597 228 307
Asset/liability management mortgage portfolio 122 454 480
Whole mortgage loan sale gains 500 20 13
Liquidating businesses 475 1,363 1,042
SFAS 133 transition adjustment net loss –(106) –
Gain on sale of a business ––187
Other (400) (126) (21)
Consolidated revenue $ 35,082 $ 34,981 $ 33,253
Segments’ net income $ 7,886 $ 7,316 $ 7,347
Adjustments, net of taxes:
Earnings associated with unassigned capital 402 146 196
Asset/liability management mortgage portfolio 59 281 305
Liquidating businesses 18 204 63
SFAS 133 transition adjustment net loss –(68) –
Whole mortgage loan sale gains 337 13 8
Gain on sale of a business –– 117
Provision for credit losses in excess of net charge-offs –(182) (86)
Gains on sales of securities 460 332 25
Severance charge (86) (96) –
Litigation expense –(214) –
Exit charges –(1,250) –
Restructuring charges –– (346)
Tax benefit associated with basis difference in subsidiary stock –267 –
Tax settlement 488 ––
Other (315) 43 (112)
Consolidated net income $ 9,249 $ 6,792 $ 7,517
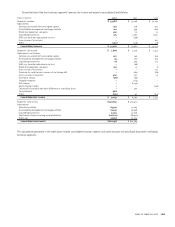
Segments’ total assets $ 590,852 $ 533,501
Adjustments:
Securities portfolio 65,979 71,563
Asset/liability management mortgage portfolio 65,447 39,658
Liquidating businesses 9,294 15,679
Elimination of excess earning asset allocations (106,672) (68,991)
Other, net 35,558 30,354
Consolidated total assets $ 660,458 $ 621,764
The adjustments presented in the table above include consolidated income, expense and asset amounts not specifically allocated to individual
business segments.
BANK OF AMERICA 2002 109