Bank of America 2002 Annual Report Download - page 64
Download and view the complete annual report
Please find page 64 of the 2002 Bank of America annual report below. You can navigate through the pages in the report by either clicking on the pages listed below, or by using the keyword search tool below to find specific information within the annual report.-
 1
1 -
2
-
3
-
4
-
5
-
6
-
7
-
8
-
9
-
10
-
11
-
12
-
13
-
14
-
15
-
16
-
17
-
18
-
19
-
20
-
21
-
22
-
23
-
24
-
25
-
26
-
27
-
28
-
29
-
30
-
31
-
32
-
33
-
34
-
35
-
36
-
37
-
38
-
39
-
40
-
41
-
42
-
43
-
44
-
45
-
46
-
47
-
48
-
49
-
50
-
51
-
52
-
53
-
 54
54 -
 55
55 -
 56
56 -
 57
57 -
 58
58 -
 59
59 -
 60
60 -
 61
61 -
 62
62 -
 63
63 -
 64
64 -
 65
65 -
 66
66 -
 67
67 -
 68
68 -
 69
69 -
 70
70 -
 71
71 -
 72
72 -
 73
73 -
 74
74 -
75
-
76
-
77
-
78
-
79
-
80
-
81
-
82
-
83
-
84
-
85
-
86
-
87
-
88
-
89
-
90
-
91
-
92
-
93
-
94
-
95
-
96
-
97
-
98
-
99
-
100
-
101
-
102
-
103
-
104
-
105
-
106
-
107
-
108
-
109
-
110
-
111
-
112
-
113
-
114
-
115
-
116
 |
 |

62 BANK OF AMERICA 200262 BANK OF AMERICA 2002
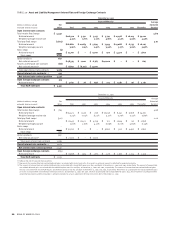
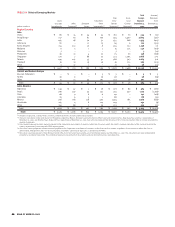
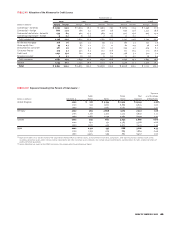
TABLE IX Selected Emerging Markets
Total Increase/
Total Gross Foreign (Decrease)
Loans Securities/ Cross- Local Exposure from
and Loan Other Derivative Other Border Country December 31, December 31,
(Dollars in millions) Commitments Financing
(1)
Assets Investments
(2)
Exposure
(3)
Exposure
(4)
2002 2001
Region/Country
Asia
China $ 80 $ 14 $ 54 $ 35 $ 183 $ 61 $ 244 $ (31)
Hong Kong(5) 157 56 82 109 404 3,400 3,804 (451)
India 405 48 70 32 555 818 1,373 (407)
Indonesia 82 – 17 15 114 6 120 (155)
Korea (South) 154 322 20 8 504 732 1,236 26
Malaysia 9 3 1 2 15 225 240 (106)
Pakistan 7 – – – 7 – 7(12)
Philippines 30 31 4 10 75 81 156 (166)
Singapore 170 7 86 10 273 1,395 1,668 270
Taiwan 294 205 35 52 586 503 1,089 176
Thailand 36 10 19 26 91 172 263 (125)
Other 3 17 1 – 21 75 96 (24)
Total $ 1,427 $ 713 $ 389 $ 299 $ 2,828 $ 7,468 $ 10,296 $ (1,005)
Central and Eastern Europe
Russian Federation $ – $ – $ – $ 5 $ 5 $ – $5$5
Turkey 30 9 – 19 58 – 58 (69)
Other 14 23 45 191 273 28 301 35
Total $44$32$45$215$336$28$ 364 $ (29)
Latin America
Argentina $ 249 $ 47 $ 2 $ 78 $ 376 $ 89 $ 465 $ (280)
Brazil 298 240 55 152 745 430 1,175 (1,299)
Chile 118986141–141 (108)
Colombia 76 6 5 1 88 – 88 (51)
Mexico 708 168 128 400 1,404 185 1,589 (638)
Venezuela 105 4 6 114 229 3 232 (9)
Other 104 89 3 29 225 – 225 (71)
Total $ 1,658 $ 563 $ 207 $ 780 $ 3,208 $ 707 $ 3,915 $ (2,456)
Total $ 3,129 $ 1,308 $ 641 $ 1,294 $ 6,372 $ 8,203 $ 14,575 $ (3,490)
(1) Includes acceptances, standby letters of credit, commercial letters of credit and formal guarantees.
(2) Amounts outstanding in the table above for Philippines, Argentina, Mexico, Venezuela and Latin America Other have been reduced by $12, $90, $505, $131 and $37, respectively, at
December 31, 2002, and $10, $0, $436, $105 and $32, respectively, at December 31, 2001. Such amounts represent the fair value of U.S. Treasury securities held as collateral outside the
country of exposure.
(3) Cross-border exposure includes amounts payable to the Corporation by residents of countries other than the one in which the credit is booked, regardless of the currency in which the
claim is denominated, consistent with FFIEC reporting rules.
(4) Gross local country exposure includes amounts payable to the Corporation by residents of countries in which the credit is booked, regardless of the currency in which the claim is
denominated. Management does not net local funding or liabilities against local exposures as allowed by the FFIEC.
(5) Gross local country exposure to Hong Kong consisted of $1,828 of consumer loans and $1,572 of commercial exposure at December 31, 2002. The consumer loans were collateralized
primarily by residential real estate. The commercial exposure was primarily to local clients and was diversified across many industries.