Bank of America 2002 Annual Report Download - page 37
Download and view the complete annual report
Please find page 37 of the 2002 Bank of America annual report below. You can navigate through the pages in the report by either clicking on the pages listed below, or by using the keyword search tool below to find specific information within the annual report.-
 1
1 -
2
-
3
-
4
-
5
-
6
-
7
-
8
-
9
-
10
-
11
-
12
-
13
-
14
-
15
-
16
-
17
-
18
-
19
-
20
-
21
-
22
-
23
-
24
-
25
-
26
-
 27
27 -
 28
28 -
 29
29 -
 30
30 -
 31
31 -
 32
32 -
 33
33 -
 34
34 -
 35
35 -
 36
36 -
 37
37 -
 38
38 -
 39
39 -
 40
40 -
 41
41 -
 42
42 -
 43
43 -
 44
44 -
 45
45 -
 46
46 -
 47
47 -
48
-
49
-
50
-
51
-
52
-
53
-
54
-
55
-
56
-
57
-
58
-
59
-
60
-
61
-
62
-
63
-
64
-
65
-
66
-
67
-
68
-
69
-
70
-
71
-
72
-
73
-
74
-
75
-
76
-
77
-
78
-
79
-
80
-
81
-
82
-
83
-
84
-
85
-
86
-
87
-
88
-
89
-
90
-
91
-
92
-
93
-
94
-
95
-
96
-
97
-
98
-
99
-
100
-
101
-
102
-
103
-
104
-
105
-
106
-
107
-
108
-
109
-
110
-
111
-
112
-
113
-
114
-
115
-
116
 |
 |

BANK OF AMERICA 2002 35
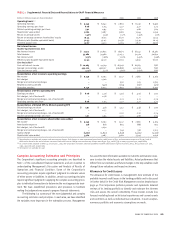
Noninterest income declined $1.0 billion, or 21 percent, due to a sharp
decline in trading account profits and a decline in investment banking
income, partially offset by increases in investment and brokerage
services and service charges. Service charges increased four percent to
$1.2 billion as many corporate customers chose to pay higher fees
rather than increase deposit balances in the lower rate environment.
Investment and brokerage services increased 35 percent to $636 mil-
lion primarily driven by a shift to commissions based on a fixed rate
rather than a variable spread. Commissions based on a fixed rate are
recorded in investment and brokerage services while those based on
variable spread are recorded in trading account profits.
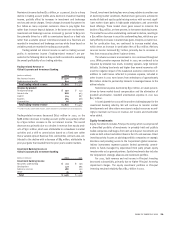
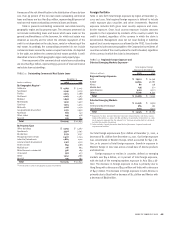
Trading-related net interest income as well as trading account
profits in noninterest income (“trading-related revenue”) are pre-
sented in the following table as they are both considered in evaluating
the overall profitability of our trading activities.
Trading-related Revenue in
Global Corporate and Investment Banking
(Dollars in millions)
2002 2001
Net interest income $ 1,970 $ 1,609
Trading account profits 830 1,818
Total trading-related revenue $ 2,800 $ 3,427
Revenue by product
Foreign exchange $ 530 $ 541
Interest rate 886 923
Credit(1) 914 887
Equities 384 906
Commodities 86 170
Total trading-related revenue $ 2,800 $ 3,427
(1) Credit includes credit fixed income, credit derivatives and hedges of credit exposure.
Trading-related revenue decreased $627 million in 2002, as the
$988 million decrease in trading account profits was partially offset
by a $361 million increase in the net interest income. The overall
decrease was primarily due to a decline in revenue from equity prod-
ucts of $522 million, which was attributable to a slowdown in market
activities and a shift to commissions based on a fixed rate rather
than a variable spread. Revenue from commodities contracts also con-
tributed to the decline with a decrease of $84 million, attributable to
prior year gains that resulted from the prior year’s volatile markets.
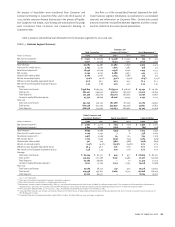
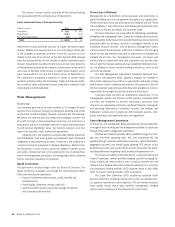
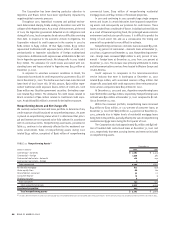
Investment Banking Income in
Global Corporate and Investment Banking
(Dollars in millions)
2002 2001
Investment banking income
Securities underwriting $ 721 $ 796
Syndications 427 395
Advisory services 288 251
Other 45 84
Total $ 1,481 $ 1,526
Overall, investment banking fees were strong relative to another year
of declining market conditions. Market share gains were achieved in
nearly all debt and equity capital raising services with our most signif-
icant market share gains in high grade originations and convertible
bond offerings. These market share gains served to minimize the
decline of $45 million, or three percent, in investment banking income.
The market for securities underwriting continued to decline, resulting in
a $75 million decrease in securities underwriting fees, which was par-
tially offset by increases in market share gains. Despite a smaller mar-
ket for syndication fees, we continued to increase market share,
which drove an increase in syndication fees of $32 million. Advisory
services income increased $37 million, primarily due to increases in
fees from restructuring clients’ balance sheets.
The adverse economic environment in 2001 continued throughout
2002. While provision expense declined in 2002, we continued to be
impacted by elevated loss levels, including sporadic, large borrower
defaults. Declining loan levels and higher than normal recoveries soft-
ened the negative impact of the weakened economic environment. In
addition to credit losses reflected in provision expense, included in
other income in 2002 were losses from writedowns of approximately
$82 million related to partnership interests in leveraged leases to the
airline industry.
Noninterest expense declined by $392 million, or seven percent,
driven by lower market-based compensation and the elimination of
goodwill amortization. Goodwill amortization expense in 2001 was
$117 million.
It is anticipated that 2003 will be another challenging year for the
investment banking industry. We will continue to monitor market
developments and take actions necessary to adjust resources accord-
ingly to maintain our focus on revenue, net income and shareholder
value added.
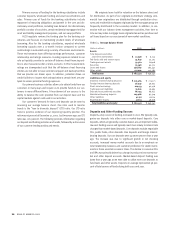
Equity Investments
Equity Investments includes Principal Investing, which is comprised of
a diversified portfolio of investments in privately held and publicly
traded companies at all stages, from start-up to buyout. Investments are
made on both a direct and indirect basis in the U.S. and overseas. Direct
investing activity focuses on advising portfolio companies on strategic
directions and providing access to the Corporation’s global resources.
Indirect investments represent passive limited partnership commit-
ments to funds managed by experienced third party private equity
investors who act as general partners. Equity Investments also includes
the Corporation’s strategic alliances and investment portfolio.
For 2002, both revenue and net income in Principal Investing
decreased substantially, primarily due to higher Principal Investing
impairment charges. The equity investment portfolio in Principal
Investing remained relatively flat at $5.7 billion in 2002.