Bank of America 2002 Annual Report Download - page 58
Download and view the complete annual report
Please find page 58 of the 2002 Bank of America annual report below. You can navigate through the pages in the report by either clicking on the pages listed below, or by using the keyword search tool below to find specific information within the annual report.-
 1
1 -
2
-
3
-
4
-
5
-
6
-
7
-
8
-
9
-
10
-
11
-
12
-
13
-
14
-
15
-
16
-
17
-
18
-
19
-
20
-
21
-
22
-
23
-
24
-
25
-
26
-
27
-
28
-
29
-
30
-
31
-
32
-
33
-
34
-
35
-
36
-
37
-
38
-
39
-
40
-
41
-
42
-
43
-
44
-
45
-
46
-
47
-
 48
48 -
 49
49 -
 50
50 -
 51
51 -
 52
52 -
 53
53 -
 54
54 -
 55
55 -
 56
56 -
 57
57 -
 58
58 -
 59
59 -
 60
60 -
 61
61 -
 62
62 -
 63
63 -
 64
64 -
 65
65 -
 66
66 -
 67
67 -
 68
68 -
69
-
70
-
71
-
72
-
73
-
74
-
75
-
76
-
77
-
78
-
79
-
80
-
81
-
82
-
83
-
84
-
85
-
86
-
87
-
88
-
89
-
90
-
91
-
92
-
93
-
94
-
95
-
96
-
97
-
98
-
99
-
100
-
101
-
102
-
103
-
104
-
105
-
106
-
107
-
108
-
109
-
110
-
111
-
112
-
113
-
114
-
115
-
116
 |
 |

56 BANK OF AMERICA 2002
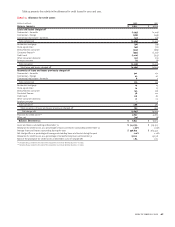
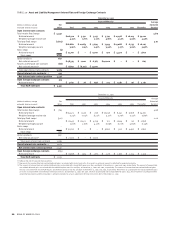
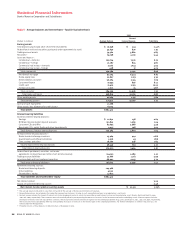
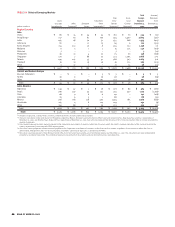
TABLE I Average Balances and Interest Rates – Taxable-Equivalent Basis
2002
Interest
(Dollars in millions) Average Balance Income/Expense Yield/Rate
Earning assets
Time deposits placed and other short-term investments $ 10,038 $ 243 2.42%
Federal funds sold and securities purchased under agreements to resell 45,640 870 1.91
Trading account assets 79,562 3,860 4.85
Securities(1) 75,298 4,100 5.44
Loans and leases(2):
Commercial – domestic 109,724 7,370 6.72
Commercial – foreign 21,287 824 3.87
Commercial real estate – domestic 21,161 1,043 4.93
Commercial real estate – foreign 408 17 4.23
Total commercial 152,580 9,254 6.06
Residential mortgage 97,204 6,423 6.61
Home equity lines 22,807 1,213 5.32
Direct/Indirect consumer 30,264 2,145 7.09
Consumer finance 10,533 856 8.12
Credit card 21,410 2,195 10.25
Foreign consumer 2,021 74 3.68
Total consumer 184,239 12,906 7.01
Total loans and leases 336,819 22,160 6.58
Other earning assets 26,164 1,517 5.80
Total earning assets(3) 573,521 32,750 5.71
Cash and cash equivalents 21,166
Other assets, less allowance for credit losses 67,714
Total assets $ 662,401
Interest-bearing liabilities
Domestic interest-bearing deposits:
Savings $ 21,691 138 0.64
NOW and money market deposit accounts 131,841 1,369 1.04
Consumer CDs and IRAs 67,695 2,968 4.39
Negotiable CDs, public funds and other time deposits 4,237 128 3.03
Total domestic interest-bearing deposits 225,464 4,603 2.04
Foreign interest-bearing deposits(4):
Banks located in foreign countries 15,464 442 2.86
Governments and official institutions 2,316 43 1.86
Time, savings and other 18,769 346 1.84
Total foreign interest-bearing deposits 36,549 831 2.27
Total interest-bearing deposits 262,013 5,434 2.07
Federal funds purchased, securities sold under
agreements to repurchase and other short-term borrowings 104,153 2,089 2.01
Trading account liabilities 31,600 1,261 3.99
Long-term debt and trust preferred securities 66,045 2,455 3.72
Total interest-bearing liabilities(3) 463,811 11,239 2.42
Noninterest-bearing sources:
Noninterest-bearing deposits 109,466
Other liabilities 41,511
Shareholders’ equity 47,613
Total liabilities and shareholders’ equity $ 662,401
Net interest spread 3.29
Impact of noninterest-bearing sources 0.46
Net interest income/yield on earning assets $ 21,511 3.75%
(1) The average balance and yield on securities are based on the average of historical amortized cost balances.
(2) Nonperforming loans are included in the respective average loan balances. Income on such nonperforming loans is recognized on a cash basis.
(3) Interest income includes the impact of interest rate risk management contracts, which increased (decreased) interest income on the underlying assets $1,983, $978 and $(48) in 2002,
2001 and 2000, respectively. These amounts were substantially offset by corresponding decreases or increases in the income earned on the underlying assets. Interest expense includes
the impact of interest rate risk management contracts, which (increased) decreased interest expense on the underlying liabilities $(141), $63 and $(36) in 2002, 2001 and 2000, respectively.
These amounts were substantially offset by corresponding decreases or increases in the interest paid on the underlying liabilities. For further information on interest rate contracts, see
Interest Rate Risk Management.
(4) Primarily consists of time deposits in denominations of $100,000 or more.
Statistical Financial Information
Bank of America Corporation and Subsidiaries