Bank of America 2002 Annual Report Download - page 31
Download and view the complete annual report
Please find page 31 of the 2002 Bank of America annual report below. You can navigate through the pages in the report by either clicking on the pages listed below, or by using the keyword search tool below to find specific information within the annual report.-
 1
1 -
2
-
3
-
4
-
5
-
6
-
7
-
8
-
9
-
10
-
11
-
12
-
13
-
14
-
15
-
16
-
17
-
18
-
19
-
20
-
 21
21 -
 22
22 -
 23
23 -
 24
24 -
 25
25 -
 26
26 -
 27
27 -
 28
28 -
 29
29 -
 30
30 -
 31
31 -
 32
32 -
 33
33 -
 34
34 -
 35
35 -
 36
36 -
 37
37 -
 38
38 -
 39
39 -
 40
40 -
 41
41 -
42
-
43
-
44
-
45
-
46
-
47
-
48
-
49
-
50
-
51
-
52
-
53
-
54
-
55
-
56
-
57
-
58
-
59
-
60
-
61
-
62
-
63
-
64
-
65
-
66
-
67
-
68
-
69
-
70
-
71
-
72
-
73
-
74
-
75
-
76
-
77
-
78
-
79
-
80
-
81
-
82
-
83
-
84
-
85
-
86
-
87
-
88
-
89
-
90
-
91
-
92
-
93
-
94
-
95
-
96
-
97
-
98
-
99
-
100
-
101
-
102
-
103
-
104
-
105
-
106
-
107
-
108
-
109
-
110
-
111
-
112
-
113
-
114
-
115
-
116
 |
 |

BANK OF AMERICA 2002 29
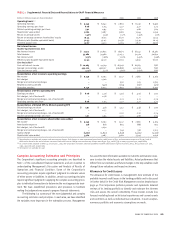
Complex Accounting Estimates and Principles
The Corporation’s significant accounting principles are described in
Note 1 of the consolidated financial statements and are essential to
understanding Management’s Discussion and Analysis of Results of
Operations and Financial Condition. Some of the Corporation’s
accounting principles require significant judgment to estimate values
of either assets or liabilities. In addition, certain accounting principles
require significant judgment in applying the complex accounting princi-
ples to individual transactions to determine the most appropriate treat-
ment. We have established procedures and processes to facilitate
making the judgments necessary to prepare financial statements.
The following is a summary of the more judgmental and complex
accounting estimates and principles. In each area, we have identified
the variables most important in the estimation process. Management
has used the best information available to make the estimations neces-
sary to value the related assets and liabilities. Actual performance that
differs from our estimates and future changes in the key variables could
change future valuations and impact net income.
Allowance for Credit Losses
The allowance for credit losses is management’s best estimate of the
probable incurred credit losses in the lending portfolio and is discussed
in further detail in the Credit Risk Management section beginning on
page 41. The Corporation performs periodic and systematic detailed
reviews of its lending portfolio to identify and estimate the inherent
risks and assess the overall collectibility. These reviews include loss
forecast modeling based on historical experiences and current events
and conditions as well as individual loan valuations. In each analysis,
numerous portfolio and economic assumptions are made.
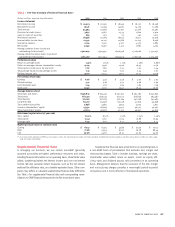
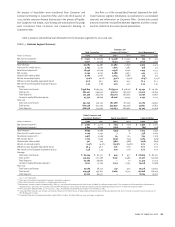
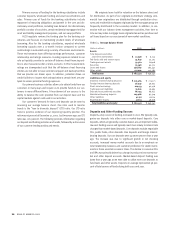
TABLE 2 Supplemental Financial Data and Reconciliations to GAAP Financial Measures
(Dollars in millions, except per share information)
2002 2001 2000 1999 1998
Operating basis(1,2)
Operating earnings $ 9,249 $ 8,042 $ 7,863 $ 8,240 $ 6,490
Operating earnings per share 6.08 5.04 4.77 4.77 3.73
Diluted operating earnings per share 5.91 4.95 4.72 4.68 3.64
Shareholder value added 3,760 3,087 3,081 3,544 2,056
Return on average assets 1.40% 1.24% 1.17% 1.34% 1.11%
Return on average common shareholders’ equity 19.44 16.53 16.70 17.70 14.54
Efficiency ratio (taxable-equivalent basis) 52.55 55.47 54.38 55.30 61.15
Dividend payout ratio 40.07 45.13 43.04 38.77 39.90
Net interest income
Taxable-equivalent basis data
Net interest income $ 21,511 $ 20,633 $ 18,671 $ 18,342 $ 18,461
Total revenue 35,082 34,981 33,253 32,521 30,650
Net interest yield 3.75% 3.68% 3.20% 3.45% 3.69%
Efficiency ratio (taxable-equivalent basis) 52.55 59.20 56.03 56.92 67.00
Core basis data(3)
Core net interest income $ 20,063 $ 19,719 $ 18,546 $ 18,583 N/A
Average core earnings assets 455,200 468,317 506,898 472,329 N/A
Core net interest yield 4.41% 4.21% 3.66% 3.93% N/A
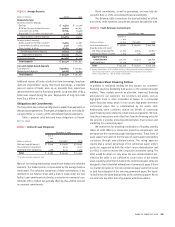
Reconciliation of net income to operating earnings
Net income $ 9,249 $ 6,792 $ 7,517 $ 7,882 $ 5,165
Exit charges –1,700 – – –
Merger and restructuring charges –– 550 525 1,795
Related income tax benefit –(450) (204) (167) (470)
Operating earnings 9,249 8,042 7,863 8,240 6,490
Reconciliation of EPS to operating EPS
Earnings per share $6.08 $ 4.26 $ 4.56 $ 4.56 $ 2.97
Exit charges, net of tax benefit –0.78 – – –
Merger and restructuring charges, net of tax benefit –– 0.21 0.21 0.76
Operating earnings per share 6.08 5.04 4.77 4.77 3.73
Reconciliation of diluted EPS to diluted operating EPS
Diluted earnings per share $5.91 $ 4.18 $ 4.52 $ 4.48 $ 2.90
Exit charges, net of tax benefit –0.77 – – –
Merger and restructuring charges, net of tax benefit –– 0.20 0.20 0.74
Diluted operating earnings per share 5.91 4.95 4.72 4.68 3.64
Reconciliation of net income to shareholder value added
Net income $ 9,249 $ 6,792 $ 7,517 $ 7,882 $ 5,165
Amortization expense 218 878 864 888 902
Exit charges, net of tax benefit –1,250 – – –
Merger and restructuring charges, net of tax benefit –– 346 358 1,325
Capital charge (5,707) (5,833) (5,646) (5,584) (5,336)
Shareholder value added 3,760 3,087 3,081 3,544 2,056
(1) Operating basis excludes exit, merger and restructuring charges. Exit charges in 2001 represented provision for credit losses of $395 and noninterest expense of $1,305, both of
which were related to the exit of certain consumer finance businesses. Merger and restructuring charges were $550, $525 and $1,795 in 2000, 1999 and 1998, respectively.
(2) As a result of the adoption of SFAS 142 on January 1, 2002, the Corporation no longer amortizes goodwill. Goodwill amortization expense was $662, $635, $635 and $633 in 2001,
2000, 1999 and 1998, respectively.
(3) Information not available for 1998.