Bank of America 2002 Annual Report Download - page 61
Download and view the complete annual report
Please find page 61 of the 2002 Bank of America annual report below. You can navigate through the pages in the report by either clicking on the pages listed below, or by using the keyword search tool below to find specific information within the annual report.-
 1
1 -
2
-
3
-
4
-
5
-
6
-
7
-
8
-
9
-
10
-
11
-
12
-
13
-
14
-
15
-
16
-
17
-
18
-
19
-
20
-
21
-
22
-
23
-
24
-
25
-
26
-
27
-
28
-
29
-
30
-
31
-
32
-
33
-
34
-
35
-
36
-
37
-
38
-
39
-
40
-
41
-
42
-
43
-
44
-
45
-
46
-
47
-
48
-
49
-
50
-
 51
51 -
 52
52 -
 53
53 -
 54
54 -
 55
55 -
 56
56 -
 57
57 -
 58
58 -
 59
59 -
 60
60 -
 61
61 -
 62
62 -
 63
63 -
 64
64 -
 65
65 -
 66
66 -
 67
67 -
 68
68 -
 69
69 -
 70
70 -
 71
71 -
72
-
73
-
74
-
75
-
76
-
77
-
78
-
79
-
80
-
81
-
82
-
83
-
84
-
85
-
86
-
87
-
88
-
89
-
90
-
91
-
92
-
93
-
94
-
95
-
96
-
97
-
98
-
99
-
100
-
101
-
102
-
103
-
104
-
105
-
106
-
107
-
108
-
109
-
110
-
111
-
112
-
113
-
114
-
115
-
116
 |
 |

BANK OF AMERICA 2002 59
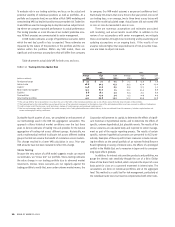
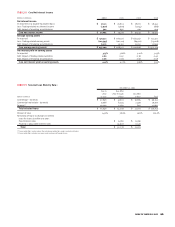
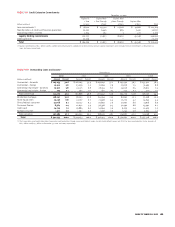
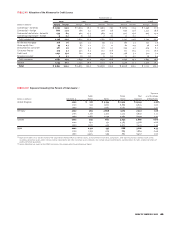
TABLE IV Selected Loan Maturity Data(1)
December 31, 2002
Due in Due After
1 Year 1 Year Through Due After
(Dollars in millions) or Less 5 Years 5 Years Total
Commercial – domestic $ 37,656 $ 41,831 $ 19,665 $ 99,152
Commercial real estate – domestic 9,066 8,345 2,499 19,910
Foreign(2) 14,324 2,562 807 17,693
Total selected loans $ 61,046 $ 52,738 $ 22,971 $ 136,755
Percent of total 44.6% 38.6% 16.8% 100.0%
Sensitivity of loans to changes in interest
rates for loans due after one year:
Fixed interest rates $ 6,780 $ 11,380
Floating or adjustable interest rates 45,958 11,591
Total $ 52,738 $ 22,971
(1) Loan maturities are based on the remaining maturities under contractual terms.
(2) Loan maturities include consumer and commercial foreign loans.
BANK OF AMERICA 2002 59
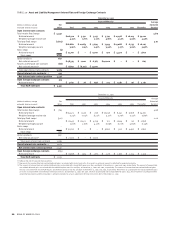
TABLE III Core Net Interest Income
(Dollars in millions)
2002 2001 2000 1999
Net interest income
As reported on a taxable-equivalent basis $ 21,511 $ 20,633 $ 18,671 $ 18,342
Less: Trading-related net interest income (1,970) (1,609) (1,044) (688)
Add: Impact of revolving securitizations 522 695 919 929
Core net interest income $ 20,063 $ 19,719 $ 18,546 $ 18,583
Average earning assets
As reported $ 573,521 $ 560,316 $ 583,467 $ 531,511
Less: Trading-related earning assets (124,593) (102,111) (89,921) (73,028)
Add: Impact of revolving securitizations 6,272 10,112 13,352 13,846
Core average earning assets $ 455,200 $ 468,317 $ 506,898 $ 472,329
Net interest yield on earning assets
As reported 3.75% 3.68% 3.20% 3.45%
Add: Impact of trading-related activities 0.60 0.47 0.38 0.40
Add: Impact of revolving securitizations 0.06 0.06 0.08 0.08
Core net interest yield on earning assets 4.41% 4.21% 3.66% 3.93%