Bank of America 2002 Annual Report Download - page 110
Download and view the complete annual report
Please find page 110 of the 2002 Bank of America annual report below. You can navigate through the pages in the report by either clicking on the pages listed below, or by using the keyword search tool below to find specific information within the annual report.-
 1
1 -
2
-
3
-
4
-
5
-
6
-
7
-
8
-
9
-
10
-
11
-
12
-
13
-
14
-
15
-
16
-
17
-
18
-
19
-
20
-
21
-
22
-
23
-
24
-
25
-
26
-
27
-
28
-
29
-
30
-
31
-
32
-
33
-
34
-
35
-
36
-
37
-
38
-
39
-
40
-
41
-
42
-
43
-
44
-
45
-
46
-
47
-
48
-
49
-
50
-
51
-
52
-
53
-
54
-
55
-
56
-
57
-
58
-
59
-
60
-
61
-
62
-
63
-
64
-
65
-
66
-
67
-
68
-
69
-
70
-
71
-
72
-
73
-
74
-
75
-
76
-
77
-
78
-
79
-
80
-
81
-
82
-
83
-
84
-
85
-
86
-
87
-
88
-
89
-
90
-
91
-
92
-
93
-
94
-
95
-
96
-
97
-
98
-
99
-
 100
100 -
 101
101 -
 102
102 -
 103
103 -
 104
104 -
 105
105 -
 106
106 -
 107
107 -
 108
108 -
 109
109 -
 110
110 -
 111
111 -
 112
112 -
 113
113 -
 114
114 -
 115
115 -
 116
116
 |
 |

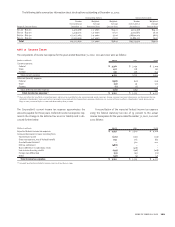
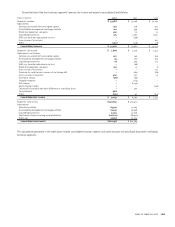
The following table includes total revenue and net income for 2002, 2001 and 2000, and total assets at December 31, 2002 and 2001 for
each business segment. Certain prior period amounts have been reclassified between segments to conform to the current period presentation.
Business Segments
For the Year Ended December 31
Consumer and
Total Corporation Commercial Banking
(1)
(Dollars in millions)
2002 2001 2000 2002 2001 2000
Net interest income(2) $ 21,511 $ 20,633 $ 18,671 $ 14,538 $ 13,243 $ 12,387
Noninterest income(3) 13,571 14,348 14,582 8,451 7,815 7,079
Total revenue 35,082 34,981 33,253 22,989 21,058 19,466
Provision for credit losses 3,697 4,287 2,535 1,805 1,582 1,031
Gains (losses) on sales of securities 630 475 25 45 3–
Amortization of intangibles(4) 218 878 864 175 633 642
Other noninterest expense 18,218 19,831 17,769 11,383 10,777 10,385
Income before income taxes 13,579 10,460 12,110 9,671 8,069 7,408
Income tax expense 4,330 3,668 4,593 3,583 3,116 2,933
Net income $ 9,249 $ 6,792 $ 7,517 $ 6,088 $ 4,953 $ 4,475
Period-end total assets $660,458 $ 621,764 $ 339,959 $304,558
For the Year Ended December 31
Global Corporate and
Asset Management
(1)
Investment Banking
(1)
(Dollars in millions)
2002 2001 2000 2002 2001 2000
Net interest income(2) $774$ 742 $ 664 $ 4,992 $ 4,727 $ 3,815
Noninterest income(3) 1,625 1,733 1,801 3,841 4,859 4,629
Total revenue 2,399 2,475 2,465 8,833 9,586 8,444
Provision for credit losses 318 121 47 1,209 1,292 752
Gains (losses) on sales of securities –––(97) (45) (15)
Amortization of intangibles(4) 657 30 32 143 138
Other noninterest expense 1,467 1,480 1,432 4,945 5,226 4,858
Income before income taxes 608 817 956 2,550 2,880 2,681
Income tax expense 204 295 368 827 924 858
Net income $ 404 $ 522 $ 588 $ 1,723 $ 1,956 $ 1,823
Period-end total assets $ 24,891 $ 26,811 $219,938 $ 195,817
For the Year Ended December 31
Equity Investments
(1)
Corporate Other
(Dollars in millions)
2002 2001 2000 2002 2001 2000
Net interest income(2) $ (152) $ (150) $ (138) $ 1,359 $ 2,071 $ 1,943
Noninterest income(3) (281) 179 1,008 (65) (238) 65
Total revenue (433) 29 870 1,294 1,833 2,008
Provision for credit losses(5) 784358 1,284 701
Gains (losses) on sales of securities –––682 517 40
Amortization of intangibles(4) 310 11 235 43
Other noninterest expense(5) 91 204 103 332 2,144 991
Income before income taxes (534) (193) 752 1,284 (1,113) 313
Income tax expense (205) (78) 291 (79) (589) 143
Net income $ (329) $ (115) $ 461 $ 1,363 $ (524) $ 170
Period-end total assets $ 6,064 $ 6,315 $ 69,606 $ 88,263
(1) There were no material intersegment revenues among the segments.
(2) Net interest income is presented on a taxable-equivalent basis.
(3) Noninterest income in 2001 included the $83 SFAS 133 transition adjustment net loss which was recorded in trading account profits. The components of the transition adjustment by
segment were a gain of $4 for Consumer and Commercial Banking, a gain of $19 for Global Corporate and Investment Banking and a loss of $106 for Corporate Other.
(4) The Corporation adopted SFAS 142 on January 1, 2002. Accordingly, no goodwill amortization was recorded in 2002.
(5) Corporate Other includes exit charges consisting of provision for credit losses of $395 and noninterest expense of $1,305 related to the exit of certain consumer finance businesses in
2001 and restructuring charges of $550 in noninterest expense in 2000.
108 BANK OF AMERICA 2002