Bank of America 2002 Annual Report Download - page 45
Download and view the complete annual report
Please find page 45 of the 2002 Bank of America annual report below. You can navigate through the pages in the report by either clicking on the pages listed below, or by using the keyword search tool below to find specific information within the annual report.-
 1
1 -
2
-
3
-
4
-
5
-
6
-
7
-
8
-
9
-
10
-
11
-
12
-
13
-
14
-
15
-
16
-
17
-
18
-
19
-
20
-
21
-
22
-
23
-
24
-
25
-
26
-
27
-
28
-
29
-
30
-
31
-
32
-
33
-
34
-
 35
35 -
 36
36 -
 37
37 -
 38
38 -
 39
39 -
 40
40 -
 41
41 -
 42
42 -
 43
43 -
 44
44 -
 45
45 -
 46
46 -
 47
47 -
 48
48 -
 49
49 -
 50
50 -
 51
51 -
 52
52 -
 53
53 -
 54
54 -
 55
55 -
56
-
57
-
58
-
59
-
60
-
61
-
62
-
63
-
64
-
65
-
66
-
67
-
68
-
69
-
70
-
71
-
72
-
73
-
74
-
75
-
76
-
77
-
78
-
79
-
80
-
81
-
82
-
83
-
84
-
85
-
86
-
87
-
88
-
89
-
90
-
91
-
92
-
93
-
94
-
95
-
96
-
97
-
98
-
99
-
100
-
101
-
102
-
103
-
104
-
105
-
106
-
107
-
108
-
109
-
110
-
111
-
112
-
113
-
114
-
115
-
116
 |
 |

BANK OF AMERICA 2002 43
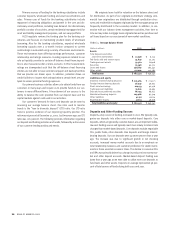
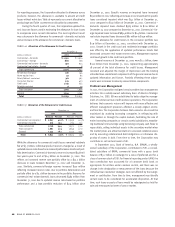
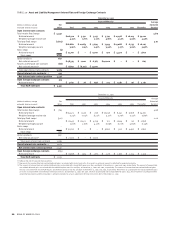
A measure of the risk diversification is the distribution of loans by loan
size. Over 99 percent of the non-real estate outstanding commercial
loans and leases are less than $50 million, representing 86 percent of
total non-real estate outstanding commercial loans and leases.
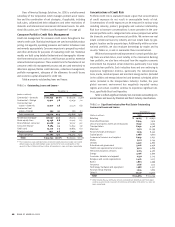
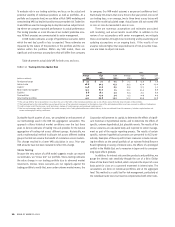
Table 11 presents outstanding commercial real estate loans by
geographic region and by property type. The amounts presented do
not include outstanding loans and leases which were made on the
general creditworthiness of the borrower, for which real estate was
obtained as security and for which the ultimate repayment of the
credit is not dependent on the sale, lease, rental or refinancing of the
real estate. Accordingly, the outstandings presented do not include
commercial loans secured by owner-occupied real estate. As depicted
in the table, we believe the commercial real estate portfolio is well-
diversified in terms of both geographic region and property type.
Over 99 percent of the commercial real estate loans outstanding
are less than $50 million, representing 95 percent of total commercial
real estate loan outstandings.
TABLE 11 Outstanding Commercial Real Estate Loans
December 31
(Dollars in millions)
2002 2001
By Geographic Region(1)
California $ 4,769 $ 5,225
Southwest 2,945 3,239
Florida 2,424 2,399
Northwest 2,067 2,363
Midwest 1,696 1,688
Mid-Atlantic 1,332 1,430
Carolinas 1,324 1,472
Midsouth 1,166 1,276
Geographically diversified 1,075 1,950
Northeast 667 750
Other states 445 478
Non-US 295 384
Total $ 20,205 $ 22,654
By Property Type
Office buildings $3,953 $ 4,567
Apartments 3,556 3,797
Residential 3,153 3,157
Shopping centers/retail 2,400 2,754
Industrial/warehouse 1,884 2,011
Land and land development 1,307 1,501
Hotels/motels 853 1,186
Multiple use 718 694
Miscellaneous commercial 378 289
Unsecured 356 433
Other 1,352 1,881
Non-US 295 384
Total $ 20,205 $ 22,654
(1) Distributions based on geographic location of collateral.
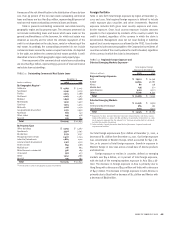
Foreign Portfolio
Table 12 sets forth total foreign exposure by region at December 31,
2002 and 2001. Total regional foreign exposure is defined to include
credit exposure plus securities and other investments. Reported
exposure includes both gross local country exposure and cross-
border exposure. Gross local country exposure includes amounts
payable to the Corporation by residents of the country in which the
credit is booked, regardless of the currency in which the claim is
denominated. Management does not net local funding or liabilities
against local country exposures as allowed by the FFIEC. Cross-border
exposure includes amounts payable to the Corporation by residents of
countries outside of the country where the credit is booked, regardless
of the currency in which the claim is denominated.
TABLE 12 Regional Foreign Exposure and
Selected Emerging Markets Exposure(1)
Total Regional Foreign
Exposure at December 31
(Dollars in millions)
2002 2001
Regional Foreign Exposure
Asia $ 13,912 $ 14,546
Europe 43,034 40,087
Africa 80 128
Middle East 435 571
Latin America 3,915 6,371
Other(2) 8,709 9,447
Total $ 70,085 $ 71,150
Selected Emerging Markets
Asia $ 10,296 $11,301
Central and Eastern Europe 364 393
Latin America 3,915 6,371
Total $ 14,575 $ 18,065
(1) Exposures for Asia and Latin America have been reduced by $12 and $763, respec-
tively, at December 31, 2002, and $10 and $573, respectively, at December 31, 2001.
Such amounts represent the fair value of U.S. Treasury securities held as collateral
outside the country of exposure.
(2) Other includes Canada, Australia, New Zealand, Bermuda, Cayman Islands and
supranational entities.
Our total foreign exposure was $70.1 billion at December 31, 2002, a
decrease of $1.1 billion from December 31, 2001. Our foreign exposure
was concentrated in Western Europe, which accounted for $42.7 bil-
lion, or 61 percent of total foreign exposure. Growth in exposure in
Western Europe in 2002 was across a broad base of diverse products
and industries.
Foreign exposure to entities in countries defined as emerging
markets was $14.6 billion, or 21 percent of total foreign exposure,
with the bulk of the emerging markets exposure in Asia ($10.3 bil-
lion). The decrease in foreign exposure in Asia is primarily due to
Hong Kong with a decrease of $451 million and India with a decrease
of $407 million. The decrease in foreign exposure in Latin America is
primarily due to Brazil with a decrease of $1.3 billion and Mexico with
a decrease of $638 million.