Bank of America 2002 Annual Report Download - page 35
Download and view the complete annual report
Please find page 35 of the 2002 Bank of America annual report below. You can navigate through the pages in the report by either clicking on the pages listed below, or by using the keyword search tool below to find specific information within the annual report.-
 1
1 -
2
-
3
-
4
-
5
-
6
-
7
-
8
-
9
-
10
-
11
-
12
-
13
-
14
-
15
-
16
-
17
-
18
-
19
-
20
-
21
-
22
-
23
-
24
-
 25
25 -
 26
26 -
 27
27 -
 28
28 -
 29
29 -
 30
30 -
 31
31 -
 32
32 -
 33
33 -
 34
34 -
 35
35 -
 36
36 -
 37
37 -
 38
38 -
 39
39 -
 40
40 -
 41
41 -
 42
42 -
 43
43 -
 44
44 -
 45
45 -
46
-
47
-
48
-
49
-
50
-
51
-
52
-
53
-
54
-
55
-
56
-
57
-
58
-
59
-
60
-
61
-
62
-
63
-
64
-
65
-
66
-
67
-
68
-
69
-
70
-
71
-
72
-
73
-
74
-
75
-
76
-
77
-
78
-
79
-
80
-
81
-
82
-
83
-
84
-
85
-
86
-
87
-
88
-
89
-
90
-
91
-
92
-
93
-
94
-
95
-
96
-
97
-
98
-
99
-
100
-
101
-
102
-
103
-
104
-
105
-
106
-
107
-
108
-
109
-
110
-
111
-
112
-
113
-
114
-
115
-
116
 |
 |

BANK OF AMERICA 2002 33
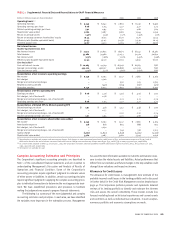
charges, partially offset by the impact of new and existing customers
choosing accounts with lower or no service charges drove the $128 mil-
lion, or five percent, increase in consumer service charges.
Increases in both debit and credit card income drove the eight
percent increase in card income. The increase in debit card income
within Banking Regions of $143 million, or 22 percent, was driven by
increases in purchase volumes. Higher annual, late, cash advance and
overlimit fees partially offset by the impact of reduced securitized
balances attributed to the $55 million, or three percent, increase in
credit card income within Consumer Products. Card income included
activity from the securitized portfolio of $168 million and $193 million
in 2002 and 2001, respectively. Noninterest income, rather than net
interest income, is recorded for assets that have been securitized as
we take on the role of servicer and record servicing income and
gains or losses on securitizations, where appropriate. New
advances under these previously securitized balances will be
recorded on our balance sheet after the revolving period of the secu-
ritization, which has the effect of increasing loans on our balance
sheet and increasing net interest income and charge-offs, with a cor-
responding reduction in noninterest income.
An increase in net mortgage production income driven by higher
mortgage sales, partially offset by declines in servicing volume due to
portfolio run-off were the main contributors to the $158 million, or
27 percent, increase in mortgage banking income within Consumer
Products. An increase in total production of first mortgage loans origi-
nated of $11.5 billion to $88.1 billion in 2002, is primarily attributed to
the current refinancing boom and the successful deployment of
LoanSolutions.
®
These factors more than offset our decision in the
second quarter of 2001 to exit the correspondent loan origination
channel in an effort to focus on the retail channel. We believe the
retail channel allows us to be more customer focused and deepen
our relationships with our customers as well as being more prof-
itable. First mortgage loan origination volume was composed of
approximately $60.0 billion of retail loans and $28.1 billion of whole-
sale loans in 2002. Retail first mortgage origination volume was 68 per-
cent of total volume in 2002 compared to 61 percent in 2001. An
increase in mortgage prepayments resulting from the significant
decrease in mortgage interest rates during 2002 drove the $28.4 bil-
lion decline in the average portfolio of first mortgage loans serviced to
$283.0 billion in 2002. Total consumer real estate originations
surpassed $100 billion in 2002. Mortgage banking assets declined
$1.8 billion or 46 percent from a year ago also due to higher prepay-
ments in the lower interest rate environment.
Higher provision in the credit card loan portfolio, partially offset
by a decline in provision within Commercial Banking resulted in a
$223 million, or 14 percent, increase in the provision for credit losses.
The increase in credit card provision was primarily attributable to the
increase in average on-balance sheet outstandings, portfolio seasoning
of outstandings from new account growth in 2000 and 2001 and a
weaker economic environment. Seasoning refers to the length of time
passed since an account was opened. The reduction in the Commercial
Banking provision was driven by the reduction in average commercial
loans and leases and improved credit quality during 2002.
Noninterest expense increased slightly, primarily attributable to
increases in processing/support costs (which included increases
related to e-commerce and debit card processing), marketing and
promotional fees, data processing expense and personnel expense as
well as the change in assumptions for the Bank of America Pension
Plan. The increase in marketing and promotional fees for the segment
was primarily due to increased advertising and marketing invest-
ments in mortgage, online banking and bill pay and card products.
The increase in data processing expense was primarily due to costs
associated with terminated contracts on discontinued software
licenses and due to an increase in online bill payers. An increase in
employee benefits expense for the segment and an increase in incen-
tive compensation due to higher mortgage production drove the
increase in personnel expense. See Note 16 of the consolidated finan-
cial statements for additional discussion of the change in assumption
for the Bank of America Pension Plan. These increases were partially
offset by the elimination of goodwill amortization. Goodwill amorti-
zation expense in 2001 was $452 million.
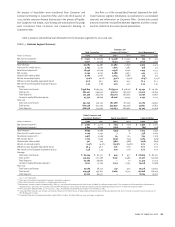
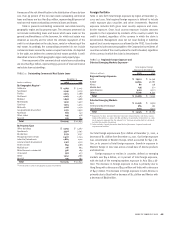
Asset Management
Asset Management includes the Private Bank, Banc of America
Investments and Banc of America Capital Management. The Private
Bank’s goal is to assist individuals and families in building and pre-
serving their wealth by providing investment, fiduciary, comprehensive
credit and banking expertise to high-net-worth clients. Banc of America
Investments provides investment, securities and financial planning
services and includes both the full-service network of investment advi-
sors and an extensive on-line investor service. Banc of America Capital
Management is an asset management organization serving the needs of
institutional clients, high-net-worth individuals and retail customers.
Banc of America Capital Management manages money and distribution
channels, provides investment solutions, offers institutional separate
accounts and wrap programs and provides advice to clients through
asset allocation expertise and software.
Despite the 23 percent drop in the S&P 500 Index from a year
ago, total revenue only declined $76 million, or three percent, in 2002.
Net income decreased $118 million, or 23 percent. The decrease in net
income drove the 64 percent decline in shareholder value added.
During 2002, Asset Management grew its distribution capabilities
to better serve the financial needs of its clients across the franchise,
surpassing its goal of increasing the number of advisors by more than
20 percent. In addition, we continue to enhance the financial planning
tools used to assist clients with their financial goals, and these financial
planning tools have received industry recognition in the market place.
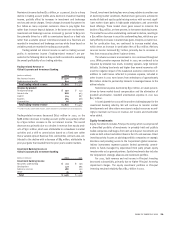
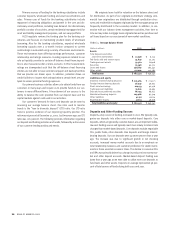
Client Assets
December 31
(Dollars in billions)
2002 2001
Assets under management $ 310.3 $ 314.2
Client brokerage assets 90.9 99.4
Assets in custody 46.6 46.9
Total client assets $ 447.8 $ 460.5