Bank of America 2002 Annual Report Download - page 88
Download and view the complete annual report
Please find page 88 of the 2002 Bank of America annual report below. You can navigate through the pages in the report by either clicking on the pages listed below, or by using the keyword search tool below to find specific information within the annual report.-
 1
1 -
2
-
3
-
4
-
5
-
6
-
7
-
8
-
9
-
10
-
11
-
12
-
13
-
14
-
15
-
16
-
17
-
18
-
19
-
20
-
21
-
22
-
23
-
24
-
25
-
26
-
27
-
28
-
29
-
30
-
31
-
32
-
33
-
34
-
35
-
36
-
37
-
38
-
39
-
40
-
41
-
42
-
43
-
44
-
45
-
46
-
47
-
48
-
49
-
50
-
51
-
52
-
53
-
54
-
55
-
56
-
57
-
58
-
59
-
60
-
61
-
62
-
63
-
64
-
65
-
66
-
67
-
68
-
69
-
70
-
71
-
72
-
73
-
74
-
75
-
76
-
77
-
 78
78 -
 79
79 -
 80
80 -
 81
81 -
 82
82 -
 83
83 -
 84
84 -
 85
85 -
 86
86 -
 87
87 -
 88
88 -
 89
89 -
 90
90 -
 91
91 -
 92
92 -
 93
93 -
 94
94 -
 95
95 -
 96
96 -
 97
97 -
 98
98 -
99
-
100
-
101
-
102
-
103
-
104
-
105
-
106
-
107
-
108
-
109
-
110
-
111
-
112
-
113
-
114
-
115
-
116
 |
 |

86 BANK OF AMERICA 2002
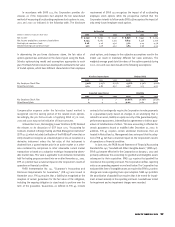
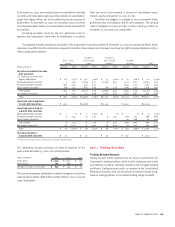
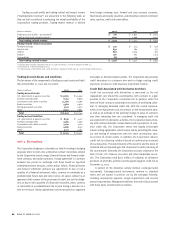
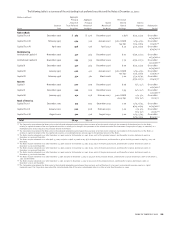
Trading account profits and trading-related net interest income
(“trading-related revenue”) are presented in the following table as
they are both considered in evaluating the overall profitability of the
Corporation’s trading positions. Trading-related revenue is derived
from foreign exchange spot, forward and cross-currency contracts,
fixed income and equity securities, and derivative contracts in interest
rates, equities, credit and commodities.
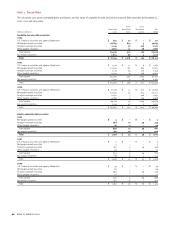
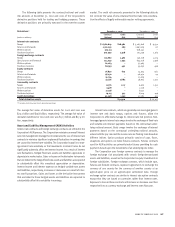
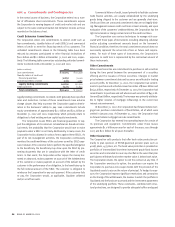
Trading Account Assets and Liabilities
The fair values of the components of trading account assets and liabil-
ities at December 31, 2002 and 2001 were:
(Dollars in millions)
2002 2001
Trading account assets
U.S. government & agency securities $ 19,875 $ 15,009
Foreign sovereign debt 8,752 6,809
Corporate & other debt securities 14,280 11,596
Equity securities 5,380 2,976
Mortgage-backed securities 5,917 3,070
Other 9,792 7,884
Total $ 63,996 $ 47,344
Trading account liabilities
U.S. government & agency securities $ 8,531 $ 4,121
Foreign sovereign debt 3,465 3,096
Corporate & other debt securities 3,032 1,501
Equity securities 4,825 6,151
Other 5,721 4,583
Total $ 25,574 $ 19,452
NOTE 5 Derivatives
The Corporation designates a derivative as held for trading or hedging
purposes when it enters into a derivative contract. Derivatives utilized
by the Corporation include swaps, financial futures and forward settle-
ment contracts, and option contracts. A swap agreement is a contract
between two parties to exchange cash flows based on specified
underlying notional amounts, assets and/or indices. Financial futures
and forward settlement contracts are agreements to buy or sell a
quantity of a financial instrument, index, currency or commodity at a
predetermined future date and rate or price. An option contract is an
agreement that conveys to the purchaser the right, but not the obliga-
tion, to buy or sell a quantity of a financial instrument, index, currency
or commodity at a predetermined rate or price during a period or at a
time in the future. Option agreements can be transacted on organized
exchanges or directly between parties. The Corporation also provides
credit derivatives to customers who wish to hedge existing credit
exposures or take on credit exposure to generate revenue.
Credit Risk Associated with Derivative Activities
Credit risk associated with derivatives is measured as the net
replacement cost should the counterparties with contracts in a gain
position to the Corporation completely fail to perform under the
terms of those contracts assuming no recoveries of underlying collat-
eral. In managing derivative credit risk, both the current exposure,
which is the replacement cost of contracts on the measurement date,
as well as an estimate of the potential change in value of contracts
over their remaining lives are considered. In managing credit risk
associated with its derivative activities, the Corporation deals prima-
rily with commercial banks, broker-dealers and corporations. To mini-
mize credit risk, the Corporation enters into legally enforceable
master netting agreements, which reduce risk by permitting the close-
out and netting of transactions with the same counterparty upon
occurrence of certain events. In addition, the Corporation reduces
credit risk by obtaining collateral based on individual assessment
of counterparties. The determination of the need for and the levels of
collateral will vary depending on the Corporation’s credit risk rating of
the counterparty. Generally, the Corporation accepts collateral in the
form of cash, U.S. Treasury securities and other marketable securi-
ties. The Corporation held $16.7 billion of collateral on derivative
positions, of which $11.4 billion could be applied against credit risk at
December 31, 2002.
A portion of the derivative activity involves exchange-traded
instruments. Exchange-traded instruments conform to standard
terms and are subject to policies set by the exchange involved,
including counterparty approval, margin requirements and security
deposit requirements. Management believes the credit risk associated
with these types of instruments is minimal.
(Dollars in millions)
2002 2001 2000
Trading account profits – as reported(1) $ 778 $ 1,842 $ 1,923
Trading-related net interest income(2) 1,970 1,609 1,023
Total trading-related revenue $ 2,748 $ 3,451 $ 2,946
Trading-related revenue by product
Foreign exchange $ 530 $ 541 $ 536
Interest rate 839 784 773
Credit(3) 893 1,054 392
Equities 400 902 1,174
Commodities 86 170 71
Total trading-related revenue $ 2,748 $ 3,451 $ 2,946
(1) Includes $83 transition adjustment net loss in 2001 recorded as a result of adoption of SFAS 133.
(2) Presented on a taxable-equivalent basis.
(3) Credit includes credit fixed income, credit derivatives, hedges of credit exposure and mortgage banking assets.