Bank of America 2002 Annual Report Download - page 40
Download and view the complete annual report
Please find page 40 of the 2002 Bank of America annual report below. You can navigate through the pages in the report by either clicking on the pages listed below, or by using the keyword search tool below to find specific information within the annual report.-
 1
1 -
2
-
3
-
4
-
5
-
6
-
7
-
8
-
9
-
10
-
11
-
12
-
13
-
14
-
15
-
16
-
17
-
18
-
19
-
20
-
21
-
22
-
23
-
24
-
25
-
26
-
27
-
28
-
29
-
 30
30 -
 31
31 -
 32
32 -
 33
33 -
 34
34 -
 35
35 -
 36
36 -
 37
37 -
 38
38 -
 39
39 -
 40
40 -
 41
41 -
 42
42 -
 43
43 -
 44
44 -
 45
45 -
 46
46 -
 47
47 -
 48
48 -
 49
49 -
 50
50 -
51
-
52
-
53
-
54
-
55
-
56
-
57
-
58
-
59
-
60
-
61
-
62
-
63
-
64
-
65
-
66
-
67
-
68
-
69
-
70
-
71
-
72
-
73
-
74
-
75
-
76
-
77
-
78
-
79
-
80
-
81
-
82
-
83
-
84
-
85
-
86
-
87
-
88
-
89
-
90
-
91
-
92
-
93
-
94
-
95
-
96
-
97
-
98
-
99
-
100
-
101
-
102
-
103
-
104
-
105
-
106
-
107
-
108
-
109
-
110
-
111
-
112
-
113
-
114
-
115
-
116
 |
 |

38 BANK OF AMERICA 2002
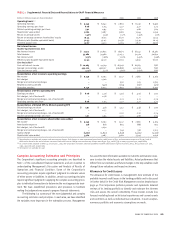
Primary sources of funding for the banking subsidiaries include
customer deposits, wholesale funding and asset securitizations and
sales. Primary uses of funds for the banking subsidiaries include
repayment of maturing obligations and growth in the core and dis-
cretionary asset portfolios, including loan demand. Our discretionary
portfolio consists of securities, certain residential mortgages held for
asset and liability management purposes, and our swap portfolio.
ALCO regularly reviews the funding plan for the banking sub-
sidiaries and focuses on maintaining prudent levels of wholesale
borrowing. Also for the banking subsidiaries, expected wholesale
borrowing capacity over a 12-month horizon compared to current
outstandings is evaluated using a variety of business environments.
These environments have differing earnings performance, customer
relationship and ratings scenarios. Funding exposure related to our
role as liquidity provider to certain off-balance sheet financing enti-
ties is also measured under a stress scenario. In this measurement,
ratings are downgraded such that the off-balance sheet financing
entities are not able to issue commercial paper and backup facilities
that we provide are drawn upon. In addition, potential draws on
credit facilities to issuers with ratings below a certain level are ana-
lyzed to assess potential funding exposure.
Our primary business activities allow us to obtain funds from our
customers in many ways and require us to provide funds to our cus-
tomers in many different forms. A key element of our success is the
ability to balance the cash provided from our deposit base and the
capital markets against cash used in our activities.
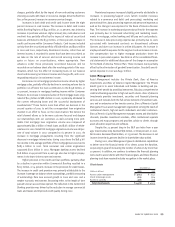
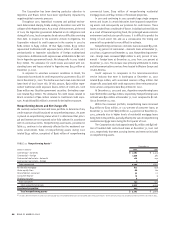
Our customers’ demand for loans and deposits can be seen by
assessing our average balance sheet. One ratio used to monitor
trends is the “loan to domestic deposit” (LTD) ratio. Our LTD ratio
trend is positive evidence of our improving liquidity position. The
ratio was 97 percent at December 31, 2002. Just two years ago, our LTD
ratio was 126 percent. The following provides information regarding
our deposit and funding activities and needs, followed by a discussion
of our customer lending activity and needs.
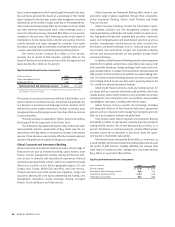
We originate loans both for retention on the balance sheet and
for distribution. As part of our originate-to-distribute strategy, com-
mercial loan originations are distributed through syndication struc-
tures and residential mortgages originated by the mortgage group are
frequently distributed in the secondary market. In addition, in con-
nection with our balance sheet management activities, from time to
time we may retain mortgage loans originated as well as purchase and
sell loans based on our assessment of new market conditions.
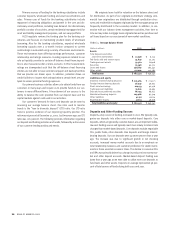
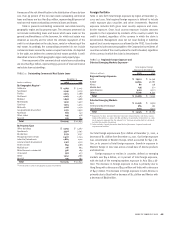
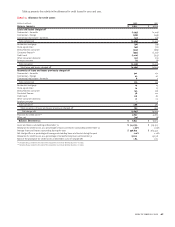
TABLE 5 Average Balance Sheet
(Dollars in millions)
2002 2001
Assets
Time deposits and other
short-term investments $10,038 $ 6,723
Fed funds sold and reverse repos 45,640 35,202
Trading account assets 79,562 66,418
Securities 75,298 60,372
Loans and leases 336,819 365,447
Other assets 115,044 115,385
Total assets $ 662,401 $ 649,547
Liabilities and equity
Domestic interest-bearing deposits $ 225,464 $ 215,171
Foreign interest-bearing deposits 36,549 49,952
Short-term borrowings 104,153 92,476
Trading account liabilities 31,600 29,995
Debt and trust preferred securities 66,045 69,622
Noninterest-bearing deposits 109,466 97,529
Other liabilities 41,511 46,124
Shareholders’ equity 47,613 48,678
Total liabilities and equity $ 662,401 $ 649,547
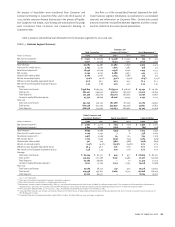
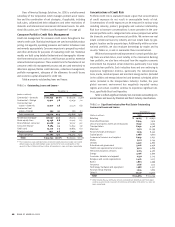
Deposits and Other Funding Sources
Deposits, a key source of funding, increased in 2002. We typically cate-
gorize our deposits into either core or market-based deposits. Core
deposits, which are generally customer-based, are an important stable,
low-cost funding source and typically react more slowly to interest rate
changes than market-based deposits. Core deposits exclude negotiable
CDs, public funds, other domestic time deposits and foreign interest-
bearing deposits. Our core deposits were up seven percent from a year
ago. The increase was due to significant growth in net checking
accounts, increased money market accounts due to an emphasis on
total relationship balances and customer preference for stable invest-
ments in these uncertain economic times. The decline in consumer CDs
and IRAs was primarily driven by a change in product mix to money mar-
ket and other deposit accounts. Market-based deposit funding was
down from a year ago as we were able to utilize more core deposits to
fund loans and other assets. Deposits on average represented 56 per-
cent of total sources of funds during both 2002 and 2001.