Bank of America 2002 Annual Report Download - page 76
Download and view the complete annual report
Please find page 76 of the 2002 Bank of America annual report below. You can navigate through the pages in the report by either clicking on the pages listed below, or by using the keyword search tool below to find specific information within the annual report.-
 1
1 -
2
-
3
-
4
-
5
-
6
-
7
-
8
-
9
-
10
-
11
-
12
-
13
-
14
-
15
-
16
-
17
-
18
-
19
-
20
-
21
-
22
-
23
-
24
-
25
-
26
-
27
-
28
-
29
-
30
-
31
-
32
-
33
-
34
-
35
-
36
-
37
-
38
-
39
-
40
-
41
-
42
-
43
-
44
-
45
-
46
-
47
-
48
-
49
-
50
-
51
-
52
-
53
-
54
-
55
-
56
-
57
-
58
-
59
-
60
-
61
-
62
-
63
-
64
-
65
-
 66
66 -
 67
67 -
 68
68 -
 69
69 -
 70
70 -
 71
71 -
 72
72 -
 73
73 -
 74
74 -
 75
75 -
 76
76 -
 77
77 -
 78
78 -
 79
79 -
 80
80 -
 81
81 -
 82
82 -
 83
83 -
 84
84 -
 85
85 -
 86
86 -
87
-
88
-
89
-
90
-
91
-
92
-
93
-
94
-
95
-
96
-
97
-
98
-
99
-
100
-
101
-
102
-
103
-
104
-
105
-
106
-
107
-
108
-
109
-
110
-
111
-
112
-
113
-
114
-
115
-
116
 |
 |

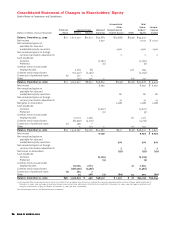
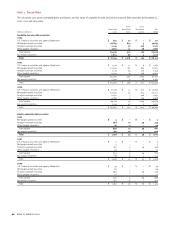
Consolidated Statement of Changes in Shareholders’ Equity
Bank of America Corporation and Subsidiaries
74 BANK OF AMERICA 200274 BANK OF AMERICA 200274 BANK OF AMERICA 200274 BANK OF AMERICA 2002
Accumulated Total
Other Share- Compre-
Preferred Common Stock Retained Comprehensive holders’ hensive
(Dollars in millions, shares in thousands) Stock Shares Amount Earnings Income (Loss)(1) Other Equity Income
Balance, December 31, 1999 $77 1,677,273 $11,671 $35,681 $(2,658) $(339) $44,432
Net income 7,517 7,517 $07,517
Net unrealized gains on
available-for-sale and
marketable equity securities 1,910 1,910 1,910
Net unrealized gains on foreign
currency translation adjustments 2 2 2
Cash dividends:
Common (3,382) (3,382)
Preferred (6) (6)
Common stock issued under
employee plans 3,781 68 226 294
Common stock repurchased (67,577) (3,256) (3,256)
Conversion of preferred stock (5) 177 5
Other (22) 125 5 (13) 117
Balance, December 31, 2000 $72 1,613,632 $8,613 $39,815 $(746) $(126) $47,628 $09,429
Net income 6,792 6,792 $06,792
Net unrealized gains on
available-for-sale and
marketable equity securities 80 80 80
Net unrealized gains on foreign
currency translation adjustments 15 15 15
Net gains on derivatives 1,088 1,088 1,088
Cash dividends:
Common (3,627) (3,627)
Preferred (5) (5)
Common stock issued under
employee plans 27,301 1,059 62 1,121
Common stock repurchased (81,939) (4,716) (4,716)
Conversion of preferred stock (7) 298 7
Other 5 113 5 26 144
Balance, December 31, 2001 $65 1,559,297 $5,076 $42,980 $437 $(38) $48,520 $07,975
Net income 9,249 9,249 $09,249
Net unrealized gains on
available-for-sale and
marketable equity securities 974 974 974
Net unrealized gains on foreign
currency translation adjustments 333
Net losses on derivatives (93) (93) (93)
Cash dividends:
Common (3,704) (3,704)
Preferred (5) (5)
Common stock issued under
employee plans 50,004 2,611 21 2,632
Common stock repurchased (108,900) (7,466) (7,466)
Conversion of preferred stock (7) 265 7
Other 25 268 (3) (89) 33 209 (89)
Balance, December 31, 2002 $58 1,500,691 $(00496 $48,517 $(1,232 $(016 $50,319 $10,044
(1) Accumulated Other Comprehensive Income (Loss) consisted of net unrealized gains (losses) on available-for-sale and marketable equity securities of $494, $(480) and $(560) at
December 31, 2002, 2001 and 2000, respectively; foreign currency translation adjustments of $(168), $(171) and $(186) at December 31, 2002, 2001 and 2000, respectively; and
net gains on derivatives of $995 and $1,088 at December 31, 2002 and 2001, respectively.
See accompanying notes to consolidated financial statements.