Bank of America 2002 Annual Report Download - page 34
Download and view the complete annual report
Please find page 34 of the 2002 Bank of America annual report below. You can navigate through the pages in the report by either clicking on the pages listed below, or by using the keyword search tool below to find specific information within the annual report.-
 1
1 -
2
-
3
-
4
-
5
-
6
-
7
-
8
-
9
-
10
-
11
-
12
-
13
-
14
-
15
-
16
-
17
-
18
-
19
-
20
-
21
-
22
-
23
-
 24
24 -
 25
25 -
 26
26 -
 27
27 -
 28
28 -
 29
29 -
 30
30 -
 31
31 -
 32
32 -
 33
33 -
 34
34 -
 35
35 -
 36
36 -
 37
37 -
 38
38 -
 39
39 -
 40
40 -
 41
41 -
 42
42 -
 43
43 -
 44
44 -
45
-
46
-
47
-
48
-
49
-
50
-
51
-
52
-
53
-
54
-
55
-
56
-
57
-
58
-
59
-
60
-
61
-
62
-
63
-
64
-
65
-
66
-
67
-
68
-
69
-
70
-
71
-
72
-
73
-
74
-
75
-
76
-
77
-
78
-
79
-
80
-
81
-
82
-
83
-
84
-
85
-
86
-
87
-
88
-
89
-
90
-
91
-
92
-
93
-
94
-
95
-
96
-
97
-
98
-
99
-
100
-
101
-
102
-
103
-
104
-
105
-
106
-
107
-
108
-
109
-
110
-
111
-
112
-
113
-
114
-
115
-
116
 |
 |

32 BANK OF AMERICA 2002
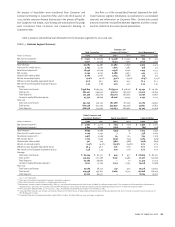
Consumer and Commercial Banking
Consumer and Commercial Banking provides a wide range of products
and services to individuals, small businesses and middle market com-
panies through multiple delivery channels.
The major components of Consumer and Commercial Banking
are Banking Regions, Consumer Products and Commercial Banking.
Banking Regions serves consumer households and small busi-
nesses in 21 states and the District of Columbia through its network of
4,208 banking centers, 13,013 ATMs, telephone, and Internet channels
on www.bankofamerica.com. Banking Regions provides a wide range
of products and services, including deposit products such as check-
ing, money market savings accounts, time deposits and IRAs, debit
card products and credit products such as home equity, mortgage and
personal auto loans. It also provides treasury management, credit
services, community investment, check card, e-commerce and broker-
age services to nearly two million small business relationships across
the franchise. Banking Regions also includes Premier Banking, which
provides high-touch banking and investment solutions to affluent
clients with balances up to $3 million.
Consumer Products provides specialized services such as the
origination, fulfillment and servicing of residential mortgage loans,
issuance and servicing of credit cards, direct banking via telephone
and Internet, student lending and certain insurance services.
Consumer Products also provides retail finance and floorplan pro-
grams to marine, RV and auto dealerships.
Commercial Banking provides commercial lending and treasury
management services primarily to middle market companies with
annual revenue between $10 million and $500 million. These services
are available through relationship manager teams as well as through
alternative channels such as the telephone via the commercial service
center and the Internet by accessing Bank of America Direct.
Commercial Banking also includes the Real Estate Banking Group,
which provides project financing and treasury management to private
developers, homebuilders and commercial real estate firms across the
U.S. Commercial Banking also provides lending and investing services
to develop low- and moderate-income communities.
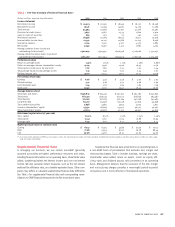
Consumer and Commercial Banking drove our financial results in
2002 as total revenue increased $1.9 billion, or nine percent. Net
income rose $1.1 billion, or 23 percent. The increase in net income and
lower economic capital, as a result of reductions in commercial loan
levels in specific industries, drove the 23 percent increase in share-
holder value added.
Throughout the year our Consumer and Commercial Banking
strategy has been to attract, retain and deepen customer relation-
ships. A critical component of that strategy includes improvement of
customer satisfaction. Customers reporting that they were delighted
with their service increased 10.4 percent during the year. As a result
of this improvement, we added 528,000 net new checking accounts
for the year, which exceeded our goal, compared to 193,000 for
2001. Access to our services through on-line banking which saw a
63 percent increase in customers, our network of domestic banking
centers, ATMs, telephone and internet channels, and our product
innovations such as an expedited mortgage application process
through LoanSolutions
®
were factors contributing to revenue growth
and success with our customers.
A favorable shift in loan mix from commercial to credit card and
residential mortgage, overall loan and deposit growth and the results
of ALM activities contributed to the $1.3 billion, or ten percent,
increase in net interest income. These increases were partially offset
by the compression of deposit interest margins.
Net interest income was positively impacted by the $5.2 billion,
or three percent, increase in average loans and leases compared to
2001. Average on-balance sheet credit card outstandings increased
29 percent, primarily due to balance transfers, the reduction in volun-
tary attrition and an increase in new advances on previously securi-
tized balances that are recorded on the Corporation’s balance sheet
after the revolving period of the securitization. Average residential
mortgage loans increased 38 percent primarily driven by the refinanc-
ing environment that began in the fourth quarter of 2001. Offsetting
these increases was a decline in average commercial loans of 12 per-
cent driven by liquidations, lower hold levels, reduced utilization of
existing facilities and soft loan demand.
Deposit growth also positively impacted net interest income.
Higher consumer deposit balances due to significant growth in net
checking accounts, increased money market accounts due to an
emphasis on total relationship balances and customer preference for
stable investments in these uncertain economic times drove
the
$17.2 billion, or seven percent, increase in average deposits to
$283.3 billion in 2002.
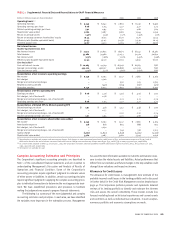
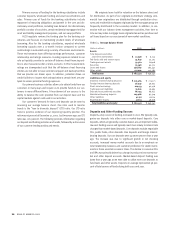
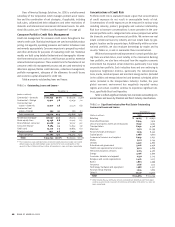
Significant Noninterest Income Components
(Dollars in millions)
2002 2001
Service charges $ 4,070 $ 3,779
Card income 2,620 2,422
Mortgage banking income 751 593
Increases in service charges, card income and mortgage banking
income drove the $636 million, or eight percent, increase in nonin-
terest income. These increases were partially offset by a decrease in
trading account profits within Consumer Products. In 2002, a
trad-
ing loss of $24 million was recorded compared to a trading gain of
$165 million in the prior year. The amount recorded in trading account
profits represents the net mark-to-market adjustments on
certain
mortgage banking assets and the related derivative instruments. See
Note 1 of the consolidated financial statements for additional infor-
mation on mortgage banking assets.
Both corporate and consumer service charges attributed to the
$291 million, or eight percent, increase in service charges. Corporate
service charges increased $163 million, or 17 percent, as customers
opted to pay service charges rather than maintain additional deposit
balances in the lower rate environment. Increased customer account