Bank of America 2002 Annual Report Download - page 29
Download and view the complete annual report
Please find page 29 of the 2002 Bank of America annual report below. You can navigate through the pages in the report by either clicking on the pages listed below, or by using the keyword search tool below to find specific information within the annual report.-
 1
1 -
2
-
3
-
4
-
5
-
6
-
7
-
8
-
9
-
10
-
11
-
12
-
13
-
14
-
15
-
16
-
17
-
18
-
 19
19 -
 20
20 -
 21
21 -
 22
22 -
 23
23 -
 24
24 -
 25
25 -
 26
26 -
 27
27 -
 28
28 -
 29
29 -
 30
30 -
 31
31 -
 32
32 -
 33
33 -
 34
34 -
 35
35 -
 36
36 -
 37
37 -
 38
38 -
 39
39 -
40
-
41
-
42
-
43
-
44
-
45
-
46
-
47
-
48
-
49
-
50
-
51
-
52
-
53
-
54
-
55
-
56
-
57
-
58
-
59
-
60
-
61
-
62
-
63
-
64
-
65
-
66
-
67
-
68
-
69
-
70
-
71
-
72
-
73
-
74
-
75
-
76
-
77
-
78
-
79
-
80
-
81
-
82
-
83
-
84
-
85
-
86
-
87
-
88
-
89
-
90
-
91
-
92
-
93
-
94
-
95
-
96
-
97
-
98
-
99
-
100
-
101
-
102
-
103
-
104
-
105
-
106
-
107
-
108
-
109
-
110
-
111
-
112
-
113
-
114
-
115
-
116
 |
 |

BANK OF AMERICA 2002 27
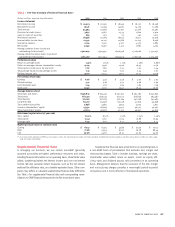
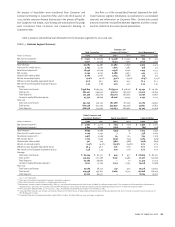
TABLE 1 Five-Year Summary of Selected Financial Data(1)
(Dollars in millions, except per share information)
2002 2001 2000 1999 1998
Income statement
Net interest income $ 20,923 $ 20,290 $ 18,349 $ 18,127 $ 18,298
Noninterest income 13,571 14,348 14,582 14,179 12,189
Total revenue 34,494 34,638 32,931 32,306 30,487
Provision for credit losses 3,697 4,287 2,535 1,820 2,920
Gains on sales of securities 630 475 25 240 1,017
Noninterest expense 18,436 20,709 18,633 18,511 20,536
Income before income taxes 12,991 10,117 11,788 12,215 8,048
Income tax expense 3,742 3,325 4,271 4,333 2,883
Net income 9,249 6,792 7,517 7,882 5,165
Average common shares issued and
outstanding (in thousands) 1,520,042 1,594,957 1,646,398 1,726,006 1,732,057
Average diluted common shares issued and
outstanding (in thousands) 1,565,467 1,625,654 1,664,929 1,760,058 1,775,760
Performance ratios
Return on average assets 1.40% 1.05% 1.12% 1.28% 0.88%
Return on average common shareholders’ equity 19.44 13.96 15.96 16.93 11.56
Total equity to total assets (at year end) 7.62 7.80 7.42 7.02 7.44
Total average equity to total average assets 7.19 7.49 7.02 7.55 7.67
Dividend payout ratio 40.07 53.44 45.02 40.54 50.18
Per common share data
Earnings $ 6.08 $ 4.26 $ 4.56 $ 4.56 $ 2.97
Diluted earnings 5.91 4.18 4.52 4.48 2.90
Cash dividends paid 2.44 2.28 2.06 1.85 1.59
Book value 33.49 31.07 29.47 26.44 26.60
Average balance sheet
Total loans and leases $ 336,819 $ 365,447 $ 392,622 $ 362,783 $347,840
Total assets 662,401 649,547 671,573 616,838 584,487
Total deposits 371,479 362,653 353,294 341,748 345,485
Long-term debt 60,207 64,638 65,338 52,619 45,098
Trust preferred securities 5,838 4,984 4,955 4,955 4,871
Common shareholders’ equity 47,552 48,609 47,057 46,527 44,467
Total shareholders’ equity 47,613 48,678 47,132 46,601 44,829
Risk-based capital ratios (at year end)
Tier 1 capital 8.22% 8.30% 7.50% 7.35% 7.06%
Total capital 12.43 12.67 11.04 10.88 10.94
Leverage ratio 6.29 6.56 6.12 6.26 6.22
Market price per share of common stock
Closing $ 69.57 $ 62.95 $ 45.88 $ 50.19 $ 60.13
High 77.08 65.54 61.00 76.38 88.44
Low 53.98 45.00 36.31 47.63 44.00
(1) As a result of the adoption of SFAS 142 on January 1, 2002, the Corporation no longer amortizes goodwill. Goodwill amortization expense was $662, $635, $635 and $633 in 2001, 2000,
1999 and 1998, respectively.
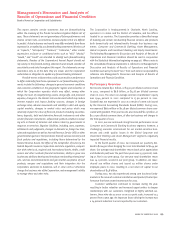
Supplemental Financial Data
In managing our business, we use certain non-GAAP (generally
accepted accounting principles) performance measures and ratios,
including financial information on an operating basis, shareholder value
added, taxable-equivalent net interest income and core net interest
income. We also calculate certain measures, such as the net interest
yield and the efficiency ratio, on a taxable-equivalent basis. Other com-
panies may define or calculate supplemental financial data differently.
See Table 2 for supplemental financial data and corresponding recon-
ciliations to GAAP financial measures for the five most recent years.
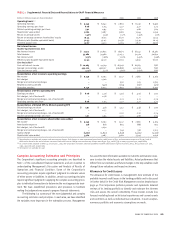
Supplemental financial data presented on an operating basis is
a non-GAAP basis of presentation that excludes exit, merger and
restructuring charges. Table 2 includes earnings, earnings per share,
shareholder value added, return on assets, return on equity, effi-
ciency ratio and dividend payout ratio presented on an operating
basis. Management believes that the exclusion of the exit, merger
and restructuring charges provides a meaningful period-to-period
comparison and is more reflective of normalized operations.