Bank of America 2002 Annual Report Download - page 2
Download and view the complete annual report
Please find page 2 of the 2002 Bank of America annual report below. You can navigate through the pages in the report by either clicking on the pages listed below, or by using the keyword search tool below to find specific information within the annual report.-
 1
1 -
 2
2 -
 3
3 -
 4
4 -
 5
5 -
 6
6 -
 7
7 -
 8
8 -
 9
9 -
 10
10 -
 11
11 -
 12
12 -
 13
13 -
14
-
15
-
16
-
17
-
18
-
19
-
20
-
21
-
22
-
23
-
24
-
25
-
26
-
27
-
28
-
29
-
30
-
31
-
32
-
33
-
34
-
35
-
36
-
37
-
38
-
39
-
40
-
41
-
42
-
43
-
44
-
45
-
46
-
47
-
48
-
49
-
50
-
51
-
52
-
53
-
54
-
55
-
56
-
57
-
58
-
59
-
60
-
61
-
62
-
63
-
64
-
65
-
66
-
67
-
68
-
69
-
70
-
71
-
72
-
73
-
74
-
75
-
76
-
77
-
78
-
79
-
80
-
81
-
82
-
83
-
84
-
85
-
86
-
87
-
88
-
89
-
90
-
91
-
92
-
93
-
94
-
95
-
96
-
97
-
98
-
99
-
100
-
101
-
102
-
103
-
104
-
105
-
106
-
107
-
108
-
109
-
110
-
111
-
112
-
113
-
114
-
115
-
116
 |
 |

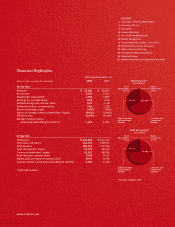
BANK OF AMERICA 2002
Global Corporate
and Investment
Banking
Equity
Investments
$(433)
2002 Revenue**
($ in millions)
$8,833
Consumer and
Commercial
Banking
$22,989
Global Corporate
and Investment
Banking
Equity
Investments
$(329)
Asset
Management
$404
2002 Net Income**
($ in millions)
$1,723
Consumer and
Commercial
Banking
$6,088
Asset
Management
$2,399
**Excludes Corporate Other
Year Ended December 31
(Dollars in millions, except per share information) 2002 2001
For the Year
Revenue* $ 35,082 $ 34,981
Net income 9,249 6,792
Shareholder value added 3,760 3,087
Earnings per common share 6.08 4.26
Diluted earnings per common share 5.91 4.18
Dividends paid per common share 2.44 2.28
Return on average assets 1.40% 1.05%
Return on average common shareholders’ equity 19.44% 13.96%
Efficiency ratio 52.55% 59.20%
Average common shares
issued and outstanding (in millions) 1,520 1,595
At Year End
Total assets $ 660,458 $ 621,764
Total loans and leases 342,755 329,153
Total deposits 386,458 373,495
Total shareholders’ equity 50,319 48,520
Common shareholders’ equity 50,261 48,455
Book value per common share 33.49 31.07
Market price per share of common stock 69.57 62.95
Common shares issued and outstanding (in millions) 1,501 1,559
*Fully taxable equivalent
Financial Highlights
CONTENTS
1Chairman’s Letter to Shareholders
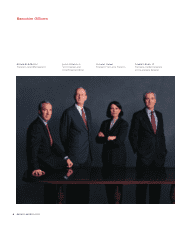
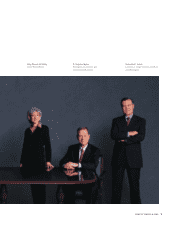
6Executive Officers
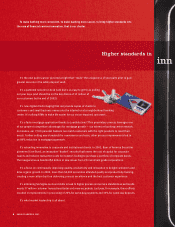
8Innovation
10 Simpler Mortgage
12 Our 14,000 Neighborhoods
14 Wealth Management
16 Across Industries, Borders, Currencies
18 Why Small Businesses Choose Us
20 Higher Standard of Living
22 Our Balanced Mix of Businesses
24 Financial Review
112 Board of Directors and Corporate Information