Bank of America 2002 Annual Report Download - page 65
Download and view the complete annual report
Please find page 65 of the 2002 Bank of America annual report below. You can navigate through the pages in the report by either clicking on the pages listed below, or by using the keyword search tool below to find specific information within the annual report.-
 1
1 -
2
-
3
-
4
-
5
-
6
-
7
-
8
-
9
-
10
-
11
-
12
-
13
-
14
-
15
-
16
-
17
-
18
-
19
-
20
-
21
-
22
-
23
-
24
-
25
-
26
-
27
-
28
-
29
-
30
-
31
-
32
-
33
-
34
-
35
-
36
-
37
-
38
-
39
-
40
-
41
-
42
-
43
-
44
-
45
-
46
-
47
-
48
-
49
-
50
-
51
-
52
-
53
-
54
-
 55
55 -
 56
56 -
 57
57 -
 58
58 -
 59
59 -
 60
60 -
 61
61 -
 62
62 -
 63
63 -
 64
64 -
 65
65 -
 66
66 -
 67
67 -
 68
68 -
 69
69 -
 70
70 -
 71
71 -
 72
72 -
 73
73 -
 74
74 -
 75
75 -
76
-
77
-
78
-
79
-
80
-
81
-
82
-
83
-
84
-
85
-
86
-
87
-
88
-
89
-
90
-
91
-
92
-
93
-
94
-
95
-
96
-
97
-
98
-
99
-
100
-
101
-
102
-
103
-
104
-
105
-
106
-
107
-
108
-
109
-
110
-
111
-
112
-
113
-
114
-
115
-
116
 |
 |

BANK OF AMERICA 2002 63BANK OF AMERICA 2002 63
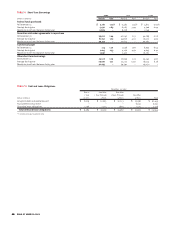
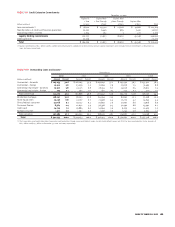
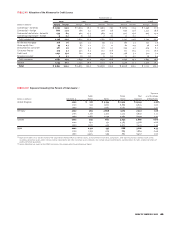
TABLE X Nonperforming Assets(1)
At December 31
(Dollars in millions)
2002 2001 2000 1999 1998
Nonperforming loans
Commercial – domestic $ 2,781 $ 3,123 $ 2,777 $ 1,163 $ 812
Commercial – foreign 1,359 461 486 486 314
Commercial real estate – domestic 161 240 236 191 299
Commercial real estate – foreign 33334
Total commercial 4,304 3,827 3,502 1,843 1,429
Residential mortgage 612 556 551 529 722
Home equity lines 66 80 32 46 50
Direct/Indirect consumer 30 27 19 19 21
Consumer finance 19 9 1,095 598 246
Foreign consumer 679714
Total consumer 733 679 1,706 1,199 1,053
Total nonperforming loans 5,037 4,506 5,208 3,042 2,482
Foreclosed properties 225 402 249 163 282
Total nonperforming assets $ 5,262 $ 4,908 $ 5,457 $ 3,205 $ 2,764
Nonperforming assets as a percentage of:
Total assets 0.80% 0.79% 0.85% 0.51% 0.45%
Outstanding loans, leases and foreclosed properties 1.53 1.49 1.39 0.86 0.77
Nonperforming loans as a percentage of outstanding loans and leases 1.47 1.37 1.33 0.82 0.69
(1) In 2002, $668 in interest income was contractually due on nonperforming loans and troubled debt restructured loans. Of this amount, $193 was actually recorded as interest income in 2002.