Bank of America 2002 Annual Report Download - page 51
Download and view the complete annual report
Please find page 51 of the 2002 Bank of America annual report below. You can navigate through the pages in the report by either clicking on the pages listed below, or by using the keyword search tool below to find specific information within the annual report.-
 1
1 -
2
-
3
-
4
-
5
-
6
-
7
-
8
-
9
-
10
-
11
-
12
-
13
-
14
-
15
-
16
-
17
-
18
-
19
-
20
-
21
-
22
-
23
-
24
-
25
-
26
-
27
-
28
-
29
-
30
-
31
-
32
-
33
-
34
-
35
-
36
-
37
-
38
-
39
-
40
-
 41
41 -
 42
42 -
 43
43 -
 44
44 -
 45
45 -
 46
46 -
 47
47 -
 48
48 -
 49
49 -
 50
50 -
 51
51 -
 52
52 -
 53
53 -
 54
54 -
 55
55 -
 56
56 -
 57
57 -
 58
58 -
 59
59 -
 60
60 -
 61
61 -
62
-
63
-
64
-
65
-
66
-
67
-
68
-
69
-
70
-
71
-
72
-
73
-
74
-
75
-
76
-
77
-
78
-
79
-
80
-
81
-
82
-
83
-
84
-
85
-
86
-
87
-
88
-
89
-
90
-
91
-
92
-
93
-
94
-
95
-
96
-
97
-
98
-
99
-
100
-
101
-
102
-
103
-
104
-
105
-
106
-
107
-
108
-
109
-
110
-
111
-
112
-
113
-
114
-
115
-
116
 |
 |

BANK OF AMERICA 2002 49
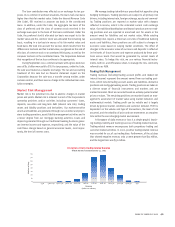
Revenue
Number of Days
(Dollars in millions)
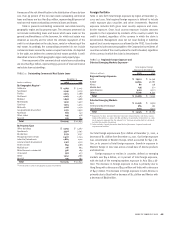
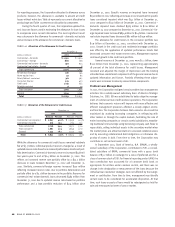
Histogram of Daily Trading-related Revenue
Twelve Months Ended December 31, 2002
<-50 -50 to -40 -40 to -30 -30 to -20 -20 to -10 -10 to 0 0 to 10 10 to 20 20 to 30 30 to 40 40 to 50 >50
0
30
60
80
70
50
40
20
10
The loan contribution was effected as an exchange for tax pur-
poses. As is common in workout situations, the loans had a tax basis
higher than their fair market value. Under the Internal Revenue Code
(the Code), SSI received a carryover tax basis in the contributed
loans. In addition, under the Code, the aggregate tax basis of the
class of preferred and the class of common stock received in the
exchange was equal to the basis of the loans contributed. Under the
Code, the preferred stock’s allocated tax basis was equal to its fair
market value and the common stock was allocated the remaining tax
basis, resulting in a tax basis in excess of its fair market value and
book basis. We took into account the tax loss which results from the
difference in tax basis and fair market value, recognized on the sale of
this class of common stock to an unrelated third party, as well as the
carryover tax basis in the contributed loans. The Corporation believes
that recognition of the tax loss continues to be appropriate.
During September 2002, commercial loans with a gross book bal-
ance of $2.7 billion were sold to SSI. For tax purposes, under the Code,
the sale was treated as a taxable exchange. The tax and accounting
treatment of this sale had no financial statement impact on the
Corporation because the sale was a transfer among entities under
common control, and there was no change in the individual loan reso-
lution strategies.
Market Risk Management
Market risk is the potential loss due to adverse changes in market
prices and yields. Market risk is inherent in most of the Corporation’s
operating positions and/or activities including customers’ loans,
deposits, securities and long-term debt (interest rate risk), trading
assets and liability positions and derivatives. Our market-sensitive
assets and liabilities are generated through our customer and propri-
etary trading operations, asset/liability management activities and to
a lesser degree from our mortgage banking activities. Loans and
deposits generated through our traditional banking business gener-
ate interest income and expense, respectively, and the value of the
cash flows change based on general economic levels, most impor-
tantly, the level of interest rates.
We manage trading risk within our proscribed risk appetite using
hedging techniques. Trading positions are subject to all primary risk
drivers, including interest rate, foreign exchange, equity and commod-
ity. Trading positions are reported at market value with changes
reflected in income, which is the estimated current cash exchange
value. Our traditional banking loan and deposit products are non-trad-
ing positions and are reported at amortized cost for assets or the
amount owed for liabilities and not market value. While existing
accounting rules require a historical cost view of traditional banking
assets and liabilities, these positions are still subject to changes in
economic value based on varying market conditions. The effect of
changes in the economic value of our loans and deposits is reflected
in the levels of future income and expense produced by these posi-
tions versus levels that would be generated by current levels of
interest rates. To hedge this risk, we use various financial instru-
ments, both on- and off-balance sheet, to manage the risk, commonly
referred to as ALM.
Trading Risk Management
Trading revenues (including trading account profits and related net
interest income) represent the amount earned from our trading posi-
tions, which include trading account assets and liabilities, derivative
positions and mortgage banking assets. Trading positions are taken in
a diverse range of financial instruments and markets and are
marked to market. Most are recorded based on actively quoted market
prices or values. The remaining positions are recorded based on man-
agement’s assessment of market value using market indicators and
mathematical models. Trading profit can be volatile and is largely
driven by general market conditions and customer demand. Profit is
dependent on the volume and type of transactions, the level of risk
assumed, and the volatility of price and rate movements at any given
time within the ever-changing market environment.
A histogram of daily revenue or loss is a simple graphic depict-
ing trading volatility and tracking success of trading-related revenue.
Trading-related revenue encompasses both proprietary trading and
customer-related activities. In 2002, positive trading-related revenue
was recorded for 215 of 251 trading days. Furthermore, of the 36 days
that showed negative revenue, only 12 were greater than $10 million,
and the largest loss was $32 million.