Bank of America 2002 Annual Report Download - page 56
Download and view the complete annual report
Please find page 56 of the 2002 Bank of America annual report below. You can navigate through the pages in the report by either clicking on the pages listed below, or by using the keyword search tool below to find specific information within the annual report.-
 1
1 -
2
-
3
-
4
-
5
-
6
-
7
-
8
-
9
-
10
-
11
-
12
-
13
-
14
-
15
-
16
-
17
-
18
-
19
-
20
-
21
-
22
-
23
-
24
-
25
-
26
-
27
-
28
-
29
-
30
-
31
-
32
-
33
-
34
-
35
-
36
-
37
-
38
-
39
-
40
-
41
-
42
-
43
-
44
-
45
-
 46
46 -
 47
47 -
 48
48 -
 49
49 -
 50
50 -
 51
51 -
 52
52 -
 53
53 -
 54
54 -
 55
55 -
 56
56 -
 57
57 -
 58
58 -
 59
59 -
 60
60 -
 61
61 -
 62
62 -
 63
63 -
 64
64 -
 65
65 -
 66
66 -
67
-
68
-
69
-
70
-
71
-
72
-
73
-
74
-
75
-
76
-
77
-
78
-
79
-
80
-
81
-
82
-
83
-
84
-
85
-
86
-
87
-
88
-
89
-
90
-
91
-
92
-
93
-
94
-
95
-
96
-
97
-
98
-
99
-
100
-
101
-
102
-
103
-
104
-
105
-
106
-
107
-
108
-
109
-
110
-
111
-
112
-
113
-
114
-
115
-
116
 |
 |

54 BANK OF AMERICA 2002
The approach described above allows the Corporation to have a dis-
cipline that anticipates and mitigates the losses from operational risks.
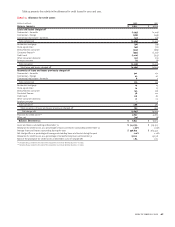
2001 Compared to 2000
The following discussion and analysis provides a comparison of the
Corporation’s results of operations for 2001 and 2000. This discussion
should be read in conjunction with the consolidated financial state-
ments and related notes on pages 72 through 111. In addition, Tables 1
and 2 contain financial data to supplement this discussion.
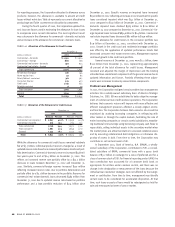
Overview
Net income totaled $6.8 billion, or $4.18 per common share (diluted),
in 2001 compared to $7.5 billion, or $4.52 per common share
(diluted), in 2000. The return on average common shareholders’
equity was 13.96 percent in 2001 compared to 15.96 percent in 2000.
Earnings excluding charges related to the Corporation’s strate-
gic decision to exit certain consumer finance businesses in 2001 and
restructuring in 2000 were $8.0 billion, or $4.95 per common share
(diluted), in 2001 compared to $7.9 billion, or $4.72 per common
share (diluted), in 2000. Excluding these charges, the return on
average common shareholders’ equity was 16.53 percent in 2001
compared
to 16.70 percent in 2000. Shareholder value added (SVA),
which excludes exit and restructuring charges, remained essentially
unchanged at $3.1 billion. For additional information on the use of
non-GAAP financial measures and reconciliations to corresponding
GAAP measures, see the Supplemental Financial Data section begin-
ning on page 27.
Total revenue was $34.6 billion, an increase of $1.7 billion from
2000. Net interest income increased $1.9 billion to $20.3 billion. The
increase was primarily due to changes in interest rates on the
Corporation’s asset and liability positions and investment portfolio
repositioning, an increased trading-related contribution, higher
deposit and equity levels and a favorable shift in loan mix. These fac-
tors were partially offset by the impact of the money market deposit
pricing initiative and a decrease in auto lease financing contributions.
Noninterest income was $14.3 billion, a $234 million decrease.
Service charges increased $401 million, or nine percent, driven by
higher business volumes and corporate customers opting to pay
higher fees rather than maintain additional deposit balances in the
lower rate environment. Income from investment and brokerage
services increased $183 million, or ten percent, largely due to higher
corporate investment and brokerage services, new asset manage-
ment business and the completed acquisition of Marsico Capital
Management LLC (Marsico), partially offset by lower broker activity
due to decreased trade volume. Mortgage banking income increased
$81 million, or 16 percent, primarily reflecting higher origination
activity and increased gains from higher loan sales to the secondary
market, partially offset by increased prepayments on mortgage loans
as a result of the declining interest rate environment. Investment
banking income increased $67 million, or four percent, as strong
growth in fixed income origination was offset by weaker demand for
syndications, equity underwriting and advisory services. Equity
investment gains decreased $763 million, or 72 percent, driven by
the
weaker equity markets. Card income increased $192 million, or
nine
percent, primarily due to new account growth in both credit and debit
card and increased purchase volume on existing accounts.
Trading
account profits decreased $81 million, or four percent, as the
SFAS
133 transition adjustment net loss and declines in trading results in
Corporate Treasury were offset by improved trading results in Global
Corporate and Investment Banking and favorable net mark-to-mar-
ket adjustments on mortgage banking certificates and the related
derivative instruments.
The provision for credit losses increased $1.8 billion in 2001 and
included $395 million associated with exiting the subprime real
estate
lending business. Net charge-offs increased $1.8 billion to $4.2 bil-
lion, or 1.16 percent of average loans and leases, primarily
due to
credit quality deterioration in the commercial – domestic portfolio and
an increase in credit card charge-offs as well as $635 million in charge-
offs associated with exiting the subprime real estate lending business.
Nonperforming assets were $4.9 billion, or 1.49 percent of loans,
leases and foreclosed properties at December 31, 2001, a $549 million
decrease from December 31, 2000. The decrease was primarily a
result of the transfer of $1.2 billion of nonperforming subprime real
estate loans to loans held for sale as well as nonperforming loan
sales, partially offset by increases in the commercial – domestic loan
portfolio that resulted from credit deterioration as companies were
affected by the weakening economic environment. The allowance for
credit losses totaled $6.9 billion or 2.09 percent of total loans and
leases at December 31, 2001, a 35 basis point increase from 1.74 per-
cent of total loans and leases at December 31, 2000.