Bank of America 2002 Annual Report Download - page 69
Download and view the complete annual report
Please find page 69 of the 2002 Bank of America annual report below. You can navigate through the pages in the report by either clicking on the pages listed below, or by using the keyword search tool below to find specific information within the annual report.-
 1
1 -
2
-
3
-
4
-
5
-
6
-
7
-
8
-
9
-
10
-
11
-
12
-
13
-
14
-
15
-
16
-
17
-
18
-
19
-
20
-
21
-
22
-
23
-
24
-
25
-
26
-
27
-
28
-
29
-
30
-
31
-
32
-
33
-
34
-
35
-
36
-
37
-
38
-
39
-
40
-
41
-
42
-
43
-
44
-
45
-
46
-
47
-
48
-
49
-
50
-
51
-
52
-
53
-
54
-
55
-
56
-
57
-
58
-
 59
59 -
 60
60 -
 61
61 -
 62
62 -
 63
63 -
 64
64 -
 65
65 -
 66
66 -
 67
67 -
 68
68 -
 69
69 -
 70
70 -
 71
71 -
 72
72 -
 73
73 -
 74
74 -
 75
75 -
 76
76 -
 77
77 -
 78
78 -
 79
79 -
80
-
81
-
82
-
83
-
84
-
85
-
86
-
87
-
88
-
89
-
90
-
91
-
92
-
93
-
94
-
95
-
96
-
97
-
98
-
99
-
100
-
101
-
102
-
103
-
104
-
105
-
106
-
107
-
108
-
109
-
110
-
111
-
112
-
113
-
114
-
115
-
116
 |
 |

BANK OF AMERICA 2002 67
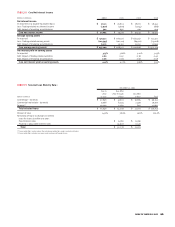
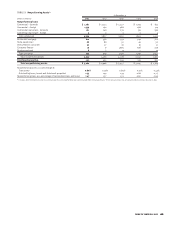
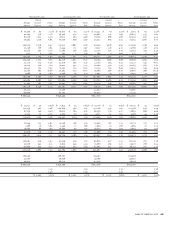
TABLE XVII Selected Quarterly Financial Data(1)
2002 Quarters 2001 Quarters
(Dollars in millions, except per share information)
Fourth Third Second First Fourth Third Second First
Income statement
Net interest income $5,374$ 5,302 $ 5,094 $ 5,153 $ 5,417 $ 5,204 $ 5,030 $ 4,639
Noninterest income 3,430 3,220 3,481 3,440 3,398 3,429 3,741 3,780
Total revenue 8,804 8,522 8,575 8,593 8,815 8,633 8,771 8,419
Provision for credit losses 1,165 804 888 840 1,401 1,251 800 835
Gains (losses) on sales of securities 304 189 93 44 393 97 (7) (8)
Noninterest expense 4,832 4,620 4,490 4,494 5,324 5,911 4,821 4,654
Income before income taxes 3,111 3,287 3,290 3,303 2,483 1,568 3,143 2,922
Income tax expense 497 1,052 1,069 1,124 426 727 1,120 1,052
Net income 2,614 2,235 2,221 2,179 2,057 841 2,023 1,870
Average common shares issued and
outstanding (in thousands) 1,499,557 1,504,017 1,533,783 1,543,471 1,570,083 1,599,692 1,601,537 1,608,890
Average diluted common shares issued and
outstanding (in thousands) 1,542,482 1,546,347 1,592,250 1,581,848 1,602,886 1,634,063 1,632,964 1,631,099
Performance ratios
Return on average assets 1.49% 1.33% 1.38% 1.39% 1.25% 0.52% 1.24% 1.17%
Return on average common shareholders’ equity 21.58 19.02 18.47 18.64 16.70 6.78 16.67 15.86
Total equity to total assets (period end) 7.62 7.31 7.48 7.77 7.80 7.83 7.88 8.02
Total average equity to total average assets 6.91 6.97 7.47 7.44 7.50 7.66 7.43 7.38
Dividend payout ratio 36.76 40.25 41.40 42.48 45.53 106.49 44.35 48.14
Per common share data
Earnings $1.74$ 1.49 $ 1.45 $ 1.41 $ 1.31 $ 0.52 $ 1.26 $ 1.16
Diluted earnings 1.69 1.45 1.40 1.38 1.28 0.51 1.24 1.15
Cash dividends paid 0.64 0.60 0.60 0.60 0.60 0.56 0.56 0.56
Book value 33.49 32.07 31.47 31.15 31.07 31.66 30.75 30.47
Average balance sheet
Total loans and leases $343,099 $340,484 $335,684 $ 327,801 $333,354 $357,726 $383,500 $ 387,889
Total assets 695,468 669,149 646,599 637,678 651,797 642,184 655,557 648,698
Total deposits 381,381 373,933 365,986 364,403 368,171 363,328 363,348 355,618
Common shareholders’ equity 48,015 46,592 48,213 47,392 48,850 49,134 48,640 47,794
Total shareholders’ equity 48,074 46,652 48,274 47,456 48,916 49,202 48,709 47,866
Risk-based capital ratios (period end)
Tier 1 capital 8.22% 8.13% 8.09% 8.48% 8.30% 7.95% 7.90% 7.65%
Total capital 12.43 12.38 12.42 12.93 12.67 12.12 12.09 11.84
Leverage ratio 6.29 6.35 6.47 6.72 6.56 6.59 6.50 6.41
Market price per share of common stock
Closing $ 69.57 $ 63.80 $ 70.36 $ 68.02 $ 62.95 $ 58.40 $ 60.03 $ 54.75
High 71.99 71.94 77.08 69.61 64.99 65.54 62.18 55.94
Low 53.98 57.90 66.82 57.51 52.10 50.25 48.65 45.00
(1) As a result of the adoption of SFAS 142 on January 1, 2002, the Corporation no longer amortizes goodwill. Goodwill amortization expense was $160, $165, $169 and $168 in the fourth,
third, second and first quarters, respectively, of 2001.