RBS 2006 Annual Report Download - page 140
Download and view the complete annual report
Please find page 140 of the 2006 RBS annual report below. You can navigate through the pages in the report by either clicking on the pages listed below, or by using the keyword search tool below to find specific information within the annual report.-
 1
1 -
2
-
3
-
4
-
5
-
6
-
7
-
8
-
9
-
10
-
11
-
12
-
13
-
14
-
15
-
16
-
17
-
18
-
19
-
20
-
21
-
22
-
23
-
24
-
25
-
26
-
27
-
28
-
29
-
30
-
31
-
32
-
33
-
34
-
35
-
36
-
37
-
38
-
39
-
40
-
41
-
42
-
43
-
44
-
45
-
46
-
47
-
48
-
49
-
50
-
51
-
52
-
53
-
54
-
55
-
56
-
57
-
58
-
59
-
60
-
61
-
62
-
63
-
64
-
65
-
66
-
67
-
68
-
69
-
70
-
71
-
72
-
73
-
74
-
75
-
76
-
77
-
78
-
79
-
80
-
81
-
82
-
83
-
84
-
85
-
86
-
87
-
88
-
89
-
90
-
91
-
92
-
93
-
94
-
95
-
96
-
97
-
98
-
99
-
100
-
101
-
102
-
103
-
104
-
105
-
106
-
107
-
108
-
109
-
110
-
111
-
112
-
113
-
114
-
115
-
116
-
117
-
118
-
119
-
120
-
121
-
122
-
123
-
124
-
125
-
126
-
127
-
128
-
129
-
 130
130 -
 131
131 -
 132
132 -
 133
133 -
 134
134 -
 135
135 -
 136
136 -
 137
137 -
 138
138 -
 139
139 -
 140
140 -
 141
141 -
 142
142 -
 143
143 -
 144
144 -
 145
145 -
 146
146 -
 147
147 -
 148
148 -
 149
149 -
 150
150 -
151
-
152
-
153
-
154
-
155
-
156
-
157
-
158
-
159
-
160
-
161
-
162
-
163
-
164
-
165
-
166
-
167
-
168
-
169
-
170
-
171
-
172
-
173
-
174
-
175
-
176
-
177
-
178
-
179
-
180
-
181
-
182
-
183
-
184
-
185
-
186
-
187
-
188
-
189
-
190
-
191
-
192
-
193
-
194
-
195
-
196
-
197
-
198
-
199
-
200
-
201
-
202
-
203
-
204
-
205
-
206
-
207
-
208
-
209
-
210
-
211
-
212
-
213
-
214
-
215
-
216
-
217
-
218
-
219
-
220
-
221
-
222
-
223
-
224
-
225
-
226
-
227
-
228
-
229
-
230
-
231
-
232
-
233
-
234
-
235
-
236
-
237
-
238
-
239
-
240
-
241
-
242
-
243
-
244
-
245
-
246
-
247
-
248
-
249
-
250
-
251
-
252
-
253
-
254
-
255
-
256
-
257
-
258
-
259
-
260
-
261
-
262
 |
 |
139
RBS Group • Annual Report and Accounts 2006
Financial statements
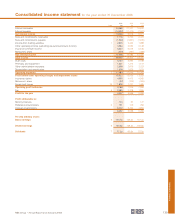
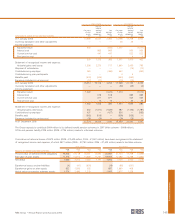
Consolidated income statement for the year ended 31 December 2006
2006 2005 2004
Note £m £m £m
Interest receivable 24,688 21,331 16,632
Interest payable (14,092) (11,413) (7,561)
Net interest income 10,596 9,918 9,071
Fees and commissions receivable 7,116 6,750 6,473
Fees and commissions payable (1,922) (1,841) (1,926)
Income from trading activities 12,675 2,343 1,988
Other operating income (excluding insurance premium income) 3,564 2,953 2,138
Insurance premium income 6,243 6,076 6,146
Reinsurers’ share (270) (297) (499)
Non-interest income 17,406 15,984 14,320
Total income 28,002 25,902 23,391
Staff costs 6,723 5,992 5,188
Premises and equipment 1,421 1,313 1,177
Other administrative expenses 2,658 2,816 2,323
Depreciation and amortisation 1,678 1,825 1,674
Operating expenses 212,480 11,946 10,362
Profit before other operating charges and impairment losses 15,522 13,956 13,029
Insurance claims 4,550 4,413 4,565
Reinsurers’ share (92) (100) (305)
Impairment losses 16 1,878 1,707 1,485
Operating profit before tax 9,186 7,936 7,284
Tax 52,689 2,378 1,995
Profit for the year 6,497 5,558 5,289
Profit attributable to:
Minority interests 104 57 177
Preference shareholders 6191 109 256
Ordinary shareholders 6,202 5,392 4,856
6,497 5,558 5,289
Per 25p ordinary share:
Basic earnings 9194.7p 169.4p 157.4p
Diluted earnings 9193.2p 168.3p 155.9p
Dividends 777.3p 60.6p 52.5p