RBS 2006 Annual Report Download - page 206
Download and view the complete annual report
Please find page 206 of the 2006 RBS annual report below. You can navigate through the pages in the report by either clicking on the pages listed below, or by using the keyword search tool below to find specific information within the annual report.-
 1
1 -
2
-
3
-
4
-
5
-
6
-
7
-
8
-
9
-
10
-
11
-
12
-
13
-
14
-
15
-
16
-
17
-
18
-
19
-
20
-
21
-
22
-
23
-
24
-
25
-
26
-
27
-
28
-
29
-
30
-
31
-
32
-
33
-
34
-
35
-
36
-
37
-
38
-
39
-
40
-
41
-
42
-
43
-
44
-
45
-
46
-
47
-
48
-
49
-
50
-
51
-
52
-
53
-
54
-
55
-
56
-
57
-
58
-
59
-
60
-
61
-
62
-
63
-
64
-
65
-
66
-
67
-
68
-
69
-
70
-
71
-
72
-
73
-
74
-
75
-
76
-
77
-
78
-
79
-
80
-
81
-
82
-
83
-
84
-
85
-
86
-
87
-
88
-
89
-
90
-
91
-
92
-
93
-
94
-
95
-
96
-
97
-
98
-
99
-
100
-
101
-
102
-
103
-
104
-
105
-
106
-
107
-
108
-
109
-
110
-
111
-
112
-
113
-
114
-
115
-
116
-
117
-
118
-
119
-
120
-
121
-
122
-
123
-
124
-
125
-
126
-
127
-
128
-
129
-
130
-
131
-
132
-
133
-
134
-
135
-
136
-
137
-
138
-
139
-
140
-
141
-
142
-
143
-
144
-
145
-
146
-
147
-
148
-
149
-
150
-
151
-
152
-
153
-
154
-
155
-
156
-
157
-
158
-
159
-
160
-
161
-
162
-
163
-
164
-
165
-
166
-
167
-
168
-
169
-
170
-
171
-
172
-
173
-
174
-
175
-
176
-
177
-
178
-
179
-
180
-
181
-
182
-
183
-
184
-
185
-
186
-
187
-
188
-
189
-
190
-
191
-
192
-
193
-
194
-
195
-
 196
196 -
 197
197 -
 198
198 -
 199
199 -
 200
200 -
 201
201 -
 202
202 -
 203
203 -
 204
204 -
 205
205 -
 206
206 -
 207
207 -
 208
208 -
 209
209 -
 210
210 -
 211
211 -
 212
212 -
 213
213 -
 214
214 -
 215
215 -
 216
216 -
217
-
218
-
219
-
220
-
221
-
222
-
223
-
224
-
225
-
226
-
227
-
228
-
229
-
230
-
231
-
232
-
233
-
234
-
235
-
236
-
237
-
238
-
239
-
240
-
241
-
242
-
243
-
244
-
245
-
246
-
247
-
248
-
249
-
250
-
251
-
252
-
253
-
254
-
255
-
256
-
257
-
258
-
259
-
260
-
261
-
262
 |
 |
RBS Group • Annual Report and Accounts 2006 205
Financial statements
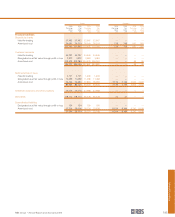
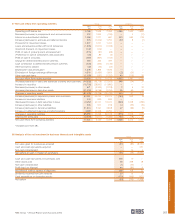
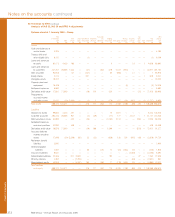
2006 2005 2004
Inter Inter Inter
External segment Total External segment Total External segment Total
Total income £m £m £m £m £m £m £m £m £m
Global Banking & Markets 8,497 (1,671) 6,826 6,311 (720) 5,591 5,343 (730) 4,613
UK Corporate Banking 5,222 (1,769) 3,453 4,696 (1,527) 3,169 4,153 (1,167) 2,986
Retail 8,072 (369) 7,703 7,673 (231) 7,442 7,423 (36) 7,387
Wealth Management (462) 1,396 934 (235) 1,049 814 18 755 773
Ulster Bank 1,109 (121) 988 973 (115) 858 800 (57) 743
Citizens 3,399 (82) 3,317 3,353 (89) 3,264 2,265 3 2,268
RBS Insurance 5,662 17 5,679 5,501 (12) 5,489 5,064 (25) 5,039
Manufacturing (85) (21) (106) (61) (34) (95) (66) — (66)
Central items (3,412) 2,620 (792) (2,642) 1,679 (963) (1,609) 1,257 (352)
28,002 — 28,002 25,569 — 25,569 23,391 — 23,391
Net gain on sale of strategic
investments — — — 333 — 333 — — —
Operating profit before tax 28,002 — 28,002 25,902 — 25,902 23,391 — 23,391
Note:
(1) Segmental results for 2005 and 2004 have been restated to reflect transfers of businesses between segments in 2006.
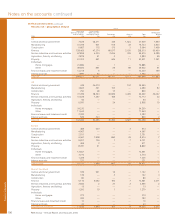
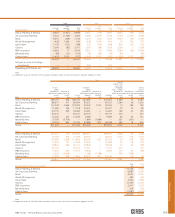
Group
Cost to
acquire fixed
assets and
Assets – Liabilities – intangible Cost to
before before assets – before acquire
allocation of Allocation of allocation of Allocation of allocation of Allocation of fixed assets
Manufacturing Manufacturing Manufacturing Manufacturing Manufacturing Manufacturing and intangible
assets assets Assets liabilities liabilities Liabilities assets assets assets
2006 £m £m £m £m £m £m £m £m £m
Global Banking & Markets 498,191 228 498,419 444,487 — 444,487 2,069 14 2,083
UK Corporate Banking 88,677 417 89,094 80,221 — 80,221 1,284 46 1,330
Retail 114,778 3,546 118,324 93,049 1,014 94,063 13 186 199
Wealth Management 11,082 196 11,278 29,421 — 29,421 79 19 98
Ulster Bank 43,119 265 43,384 34,467 — 34,467 166 24 190
Citizens 82,531 — 82,531 69,770 — 69,770 203 — 203
RBS Insurance 12,252 397 12,649 9,085 — 9,085 83 54 137
Manufacturing 5,709 (5,709) — 1,884 (1,884) — 361 (361) —
Central items 15,093 660 15,753 63,558 870 64,428 482 18 500
Group 871,432 — 871,432 825,942 — 825,942 4,740 — 4,740
2005
Global Banking & Markets 422,407 219 422,626 388,221 — 388,221 2,359 79 2,438
UK Corporate Banking 76,799 406 77,205 68,037 — 68,037 1,315 116 1,431
Retail 110,287 3,538 113,825 86,275 967 87,242 24 532 556
Wealth Management 10,078 191 10,269 26,369 — 26,369 42 58 100
Ulster Bank 35,875 256 36,131 29,878 — 29,878 77 81 158
Citizens 92,197 — 92,197 77,471 — 77,471 301 — 301
RBS Insurance 12,523 390 12,913 8,925 — 8,925 172 96 268
Manufacturing 5,638 (5,638) — 1,788 (1,788) — 998 (998) —
Central items 11,023 638 11,661 52,319 821 53,140 — 36 36
Group 776,827 — 776,827 739,283 — 739,283 5,288 — 5,288
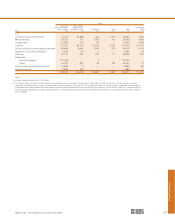
2006 2005
Shareholders’ equity by division £m £m
Global Banking & Markets 10,745 9,449
UK Corporate Banking 6,987 6,281
Retail 6,057 6,361
Wealth Management 487 462
Ulster Bank 2,960 2,256
Citizens 11,765 12,402
RBS Insurance 2,461 2,219
Manufacturing 246 264
Central items (1,481) (4,259)
Group 40,227 35,435
Note:
(1) Segmental results for 2005 have been restated to reflect transfers of businesses between segments in 2006.