RBS 2006 Annual Report Download - page 70
Download and view the complete annual report
Please find page 70 of the 2006 RBS annual report below. You can navigate through the pages in the report by either clicking on the pages listed below, or by using the keyword search tool below to find specific information within the annual report.-
 1
1 -
2
-
3
-
4
-
5
-
6
-
7
-
8
-
9
-
10
-
11
-
12
-
13
-
14
-
15
-
16
-
17
-
18
-
19
-
20
-
21
-
22
-
23
-
24
-
25
-
26
-
27
-
28
-
29
-
30
-
31
-
32
-
33
-
34
-
35
-
36
-
37
-
38
-
39
-
40
-
41
-
42
-
43
-
44
-
45
-
46
-
47
-
48
-
49
-
50
-
51
-
52
-
53
-
54
-
55
-
56
-
57
-
58
-
59
-
 60
60 -
 61
61 -
 62
62 -
 63
63 -
 64
64 -
 65
65 -
 66
66 -
 67
67 -
 68
68 -
 69
69 -
 70
70 -
 71
71 -
 72
72 -
 73
73 -
 74
74 -
 75
75 -
 76
76 -
 77
77 -
 78
78 -
 79
79 -
 80
80 -
81
-
82
-
83
-
84
-
85
-
86
-
87
-
88
-
89
-
90
-
91
-
92
-
93
-
94
-
95
-
96
-
97
-
98
-
99
-
100
-
101
-
102
-
103
-
104
-
105
-
106
-
107
-
108
-
109
-
110
-
111
-
112
-
113
-
114
-
115
-
116
-
117
-
118
-
119
-
120
-
121
-
122
-
123
-
124
-
125
-
126
-
127
-
128
-
129
-
130
-
131
-
132
-
133
-
134
-
135
-
136
-
137
-
138
-
139
-
140
-
141
-
142
-
143
-
144
-
145
-
146
-
147
-
148
-
149
-
150
-
151
-
152
-
153
-
154
-
155
-
156
-
157
-
158
-
159
-
160
-
161
-
162
-
163
-
164
-
165
-
166
-
167
-
168
-
169
-
170
-
171
-
172
-
173
-
174
-
175
-
176
-
177
-
178
-
179
-
180
-
181
-
182
-
183
-
184
-
185
-
186
-
187
-
188
-
189
-
190
-
191
-
192
-
193
-
194
-
195
-
196
-
197
-
198
-
199
-
200
-
201
-
202
-
203
-
204
-
205
-
206
-
207
-
208
-
209
-
210
-
211
-
212
-
213
-
214
-
215
-
216
-
217
-
218
-
219
-
220
-
221
-
222
-
223
-
224
-
225
-
226
-
227
-
228
-
229
-
230
-
231
-
232
-
233
-
234
-
235
-
236
-
237
-
238
-
239
-
240
-
241
-
242
-
243
-
244
-
245
-
246
-
247
-
248
-
249
-
250
-
251
-
252
-
253
-
254
-
255
-
256
-
257
-
258
-
259
-
260
-
261
-
262
 |
 |

69
RBS Group • Annual Report and Accounts 2006
Operating and financial review
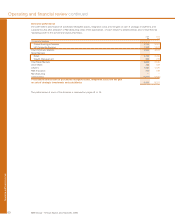
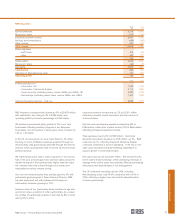
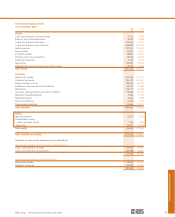
Ulster Bank
2006 2005
£m £m
Net interest income 773 655
Non-interest income 215 203
Total income 988 858
Direct expenses
– staff costs 224 191
– other 91 79
315 270
Contribution before impairment losses 673 588
Impairment losses 71 58
Contribution 602 530
Allocation of Manufacturing costs 214 207
Operating profit 388 323
£bn £bn
Total assets 43.1 35.9
Loans and advances to customers – gross
– mortgages 15.0 13.2
– corporate 19.6 13.7
– other 2.1 1.3
Customer deposits 18.0 15.9
Risk-weighted assets 28.3 22.4
Average exchange rate – /£ 1.467 1.463
Spot exchange rate – /£ 1.490 1.457
Ulster Bank made strong progress in both personal and
corporate banking in the Republic of Ireland and in Northern
Ireland, with total income rising by 15% to £988 million.
Contribution increased by 14% to £602 million and operating
profit by 20% to £388 million.
Net interest income increased by 18% to £773 million,
reflecting good growth in both loans and customer deposits.
Average loans and advances to customers increased by 28%,
and average customer deposits by 15%. A principal focus
during 2006 was the expansion of our corporate banking
franchise, and we succeeded in increasing corporate
customer numbers by 7% in the Republic of Ireland and by 4%
in Northern Ireland. This contributed to strong growth in both
corporate lending, where average loans and advances
increased by 32%, and deposits, with Ulster Bank winning a
share of new business current accounts well in excess of its
historic market share, particularly in the Republic of Ireland.
Average mortgage balances grew by 26%, although the rate of
growth was slower in the second half when there was some
evidence of a more subdued pace of expansion in the
mortgage market. The change in business mix resulting from
strong growth in corporate lending and mortgages, together
with some competitive pressures, led to a modest reduction in
net interest margin in the first half, with margin stabilising in the
second half.
Non-interest income rose by 6% to £215 million. Ulster Bank
achieved good growth in fees from credit cards and ATMs as
well as in sales of investment products, which was only
partially offset by the introduction of Ulster Bank’s new range
of current accounts, which are free of transaction fees.
Total expenses increased by 11% to £529 million, as we
continued our investment programme to support the future
growth of the business. We recruited additional customer-
facing staff, particularly in corporate banking, opened three
new business centres and continued with our branch
improvement programme. By the end of 2006, 70% of Ulster
Bank branches had been upgraded.
During 2006 we successfully completed the migration of our
core systems to the RBS Group manufacturing model and, as
a result, we now have access to the complete RBS product
range.
The credit environment remains benign. Impairment losses
rose by £13 million to £71 million, consistent with growth in
lending.