RBS 2006 Annual Report Download - page 51
Download and view the complete annual report
Please find page 51 of the 2006 RBS annual report below. You can navigate through the pages in the report by either clicking on the pages listed below, or by using the keyword search tool below to find specific information within the annual report.-
 1
1 -
2
-
3
-
4
-
5
-
6
-
7
-
8
-
9
-
10
-
11
-
12
-
13
-
14
-
15
-
16
-
17
-
18
-
19
-
20
-
21
-
22
-
23
-
24
-
25
-
26
-
27
-
28
-
29
-
30
-
31
-
32
-
33
-
34
-
35
-
36
-
37
-
38
-
39
-
40
-
 41
41 -
 42
42 -
 43
43 -
 44
44 -
 45
45 -
 46
46 -
 47
47 -
 48
48 -
 49
49 -
 50
50 -
 51
51 -
 52
52 -
 53
53 -
 54
54 -
 55
55 -
 56
56 -
 57
57 -
 58
58 -
 59
59 -
 60
60 -
 61
61 -
62
-
63
-
64
-
65
-
66
-
67
-
68
-
69
-
70
-
71
-
72
-
73
-
74
-
75
-
76
-
77
-
78
-
79
-
80
-
81
-
82
-
83
-
84
-
85
-
86
-
87
-
88
-
89
-
90
-
91
-
92
-
93
-
94
-
95
-
96
-
97
-
98
-
99
-
100
-
101
-
102
-
103
-
104
-
105
-
106
-
107
-
108
-
109
-
110
-
111
-
112
-
113
-
114
-
115
-
116
-
117
-
118
-
119
-
120
-
121
-
122
-
123
-
124
-
125
-
126
-
127
-
128
-
129
-
130
-
131
-
132
-
133
-
134
-
135
-
136
-
137
-
138
-
139
-
140
-
141
-
142
-
143
-
144
-
145
-
146
-
147
-
148
-
149
-
150
-
151
-
152
-
153
-
154
-
155
-
156
-
157
-
158
-
159
-
160
-
161
-
162
-
163
-
164
-
165
-
166
-
167
-
168
-
169
-
170
-
171
-
172
-
173
-
174
-
175
-
176
-
177
-
178
-
179
-
180
-
181
-
182
-
183
-
184
-
185
-
186
-
187
-
188
-
189
-
190
-
191
-
192
-
193
-
194
-
195
-
196
-
197
-
198
-
199
-
200
-
201
-
202
-
203
-
204
-
205
-
206
-
207
-
208
-
209
-
210
-
211
-
212
-
213
-
214
-
215
-
216
-
217
-
218
-
219
-
220
-
221
-
222
-
223
-
224
-
225
-
226
-
227
-
228
-
229
-
230
-
231
-
232
-
233
-
234
-
235
-
236
-
237
-
238
-
239
-
240
-
241
-
242
-
243
-
244
-
245
-
246
-
247
-
248
-
249
-
250
-
251
-
252
-
253
-
254
-
255
-
256
-
257
-
258
-
259
-
260
-
261
-
262
 |
 |
RBS Group • Annual Report and Accounts 2006
50
Operating and financial review continued
Operating and financial review
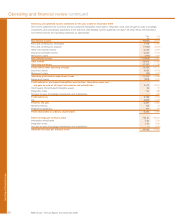
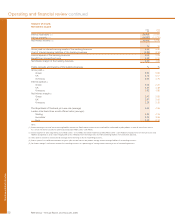
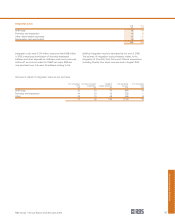
Summary consolidated income statement for the year ended 31 December 2006
The income statement set out below shows purchased intangibles amortisation, integration costs and net gain on sale of strategic
investments and subsidiaries separately. In the statutory consolidated income statement on page 139, these items are included in
non-interest income and operating expenses as appropriate.
2006 2005
£m £m
Net interest income 10,596 9,918
Fees and commissions receivable 7,116 6,750
Fees and commissions payable (1,922) (1,841)
Other non-interest income 6,239 4,963
Insurance premium income 6,243 6,076
Reinsurers’ share (270) (297)
Non-interest income 17,406 15,651
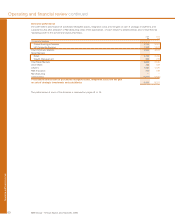
Total income 28,002 25,569
Operating expenses 12,252 11,298
Profit before other operating charges 15,750 14,271
Insurance claims 4,550 4,413
Reinsurers’ share (92) (100)
Operating profit before impairment losses 11,292 9,958
Impairment losses 1,878 1,707
Profit before tax, purchased intangibles amortisation, integration costs and
net gain on sale of strategic investments and subsidiaries 9,414 8,251
Amortisation of purchased intangible assets 94 97
Integration costs 134 458
Net gain on sale of strategic investments and subsidiaries — 240
Profit before tax 9,186 7,936
Tax 2,689 2,378
Profit for the year 6,497 5,558
Minority interests 104 57
Preference dividends 191 109
Profit attributable to ordinary shareholders 6,202 5,392
Basic earnings per ordinary share 194.7p 169.4p
Intangibles amortisation 2.0p 2.0p
Integration costs 3.3p 9.9p
Net gain on sale of strategic investments and subsidiaries — (5.4p)
Adjusted earnings per ordinary share 200.0p 175.9p