RBS 2006 Annual Report Download - page 62
Download and view the complete annual report
Please find page 62 of the 2006 RBS annual report below. You can navigate through the pages in the report by either clicking on the pages listed below, or by using the keyword search tool below to find specific information within the annual report.-
 1
1 -
2
-
3
-
4
-
5
-
6
-
7
-
8
-
9
-
10
-
11
-
12
-
13
-
14
-
15
-
16
-
17
-
18
-
19
-
20
-
21
-
22
-
23
-
24
-
25
-
26
-
27
-
28
-
29
-
30
-
31
-
32
-
33
-
34
-
35
-
36
-
37
-
38
-
39
-
40
-
41
-
42
-
43
-
44
-
45
-
46
-
47
-
48
-
49
-
50
-
51
-
 52
52 -
 53
53 -
 54
54 -
 55
55 -
 56
56 -
 57
57 -
 58
58 -
 59
59 -
 60
60 -
 61
61 -
 62
62 -
 63
63 -
 64
64 -
 65
65 -
 66
66 -
 67
67 -
 68
68 -
 69
69 -
 70
70 -
 71
71 -
 72
72 -
73
-
74
-
75
-
76
-
77
-
78
-
79
-
80
-
81
-
82
-
83
-
84
-
85
-
86
-
87
-
88
-
89
-
90
-
91
-
92
-
93
-
94
-
95
-
96
-
97
-
98
-
99
-
100
-
101
-
102
-
103
-
104
-
105
-
106
-
107
-
108
-
109
-
110
-
111
-
112
-
113
-
114
-
115
-
116
-
117
-
118
-
119
-
120
-
121
-
122
-
123
-
124
-
125
-
126
-
127
-
128
-
129
-
130
-
131
-
132
-
133
-
134
-
135
-
136
-
137
-
138
-
139
-
140
-
141
-
142
-
143
-
144
-
145
-
146
-
147
-
148
-
149
-
150
-
151
-
152
-
153
-
154
-
155
-
156
-
157
-
158
-
159
-
160
-
161
-
162
-
163
-
164
-
165
-
166
-
167
-
168
-
169
-
170
-
171
-
172
-
173
-
174
-
175
-
176
-
177
-
178
-
179
-
180
-
181
-
182
-
183
-
184
-
185
-
186
-
187
-
188
-
189
-
190
-
191
-
192
-
193
-
194
-
195
-
196
-
197
-
198
-
199
-
200
-
201
-
202
-
203
-
204
-
205
-
206
-
207
-
208
-
209
-
210
-
211
-
212
-
213
-
214
-
215
-
216
-
217
-
218
-
219
-
220
-
221
-
222
-
223
-
224
-
225
-
226
-
227
-
228
-
229
-
230
-
231
-
232
-
233
-
234
-
235
-
236
-
237
-
238
-
239
-
240
-
241
-
242
-
243
-
244
-
245
-
246
-
247
-
248
-
249
-
250
-
251
-
252
-
253
-
254
-
255
-
256
-
257
-
258
-
259
-
260
-
261
-
262
 |
 |

61
RBS Group • Annual Report and Accounts 2006
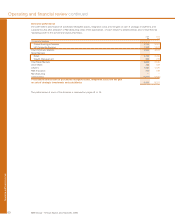
Operating and financial review
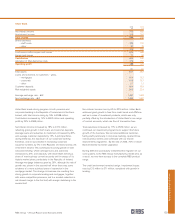
2006 2005
£m £m
Net interest income from banking activities 3,798 3,439
Non-interest income 6,481 5,321
Total income 10,279 8,760
Direct expenses
– staff costs 2,537 2,006
– other 610 521
– operating lease depreciation 736 733
3,883 3,260
Contribution before impairment losses 6,396 5,500
Impairment losses 274 335
Contribution 6,122 5,165
Allocation of Manufacturing costs 570 552
Operating profit 5,552 4,613
£bn £bn
Total assets* 472.3 409.2
Loans and advances to customers – gross*
– banking book 181.1 158.7
– trading book 15.4 11.8
Rental assets 13.9 13.2
Customer deposits* 132.5 111.1
Risk-weighted assets 231.2 202.6
* excluding repos and reverse repos
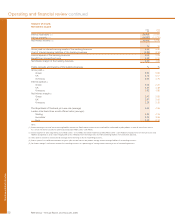
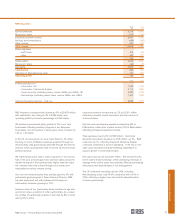
Corporate Markets achieved a strong performance in 2006,
with excellent results across many of our businesses. Total
income, after deducting operating lease depreciation, rose by
19% to £9,543 million with contribution growing by 19% to
£6,122 million. Operating profit rose by 20% to £5,552 million.
Average loans and advances grew by 19% and average
customer deposits by 17%. Our portfolio remains well
diversified by counterparty, sector and geography and
balanced in credit distribution. Assets grew strongly outside
the UK, particularly in Western Europe. Overall credit
conditions remained benign, and impairment losses
represented 0.14% of loans and advances to customers.
Average risk-weighted assets rose by 12%, with disciplined
capital allocation and increasing returns. The ratio of operating
profit to average risk-weighted assets improved from 2.3% to
2.5%.
Corporate Markets
Corporate Banking and Financial Markets was renamed Corporate Markets on 1 January 2006 when we reorganised our activities
into two businesses, Global Banking & Markets and UK Corporate Banking, in order to enhance our focus on the distinct needs of
these two customer segments.