RBS 2006 Annual Report Download - page 50
Download and view the complete annual report
Please find page 50 of the 2006 RBS annual report below. You can navigate through the pages in the report by either clicking on the pages listed below, or by using the keyword search tool below to find specific information within the annual report.-
 1
1 -
2
-
3
-
4
-
5
-
6
-
7
-
8
-
9
-
10
-
11
-
12
-
13
-
14
-
15
-
16
-
17
-
18
-
19
-
20
-
21
-
22
-
23
-
24
-
25
-
26
-
27
-
28
-
29
-
30
-
31
-
32
-
33
-
34
-
35
-
36
-
37
-
38
-
39
-
 40
40 -
 41
41 -
 42
42 -
 43
43 -
 44
44 -
 45
45 -
 46
46 -
 47
47 -
 48
48 -
 49
49 -
 50
50 -
 51
51 -
 52
52 -
 53
53 -
 54
54 -
 55
55 -
 56
56 -
 57
57 -
 58
58 -
 59
59 -
 60
60 -
61
-
62
-
63
-
64
-
65
-
66
-
67
-
68
-
69
-
70
-
71
-
72
-
73
-
74
-
75
-
76
-
77
-
78
-
79
-
80
-
81
-
82
-
83
-
84
-
85
-
86
-
87
-
88
-
89
-
90
-
91
-
92
-
93
-
94
-
95
-
96
-
97
-
98
-
99
-
100
-
101
-
102
-
103
-
104
-
105
-
106
-
107
-
108
-
109
-
110
-
111
-
112
-
113
-
114
-
115
-
116
-
117
-
118
-
119
-
120
-
121
-
122
-
123
-
124
-
125
-
126
-
127
-
128
-
129
-
130
-
131
-
132
-
133
-
134
-
135
-
136
-
137
-
138
-
139
-
140
-
141
-
142
-
143
-
144
-
145
-
146
-
147
-
148
-
149
-
150
-
151
-
152
-
153
-
154
-
155
-
156
-
157
-
158
-
159
-
160
-
161
-
162
-
163
-
164
-
165
-
166
-
167
-
168
-
169
-
170
-
171
-
172
-
173
-
174
-
175
-
176
-
177
-
178
-
179
-
180
-
181
-
182
-
183
-
184
-
185
-
186
-
187
-
188
-
189
-
190
-
191
-
192
-
193
-
194
-
195
-
196
-
197
-
198
-
199
-
200
-
201
-
202
-
203
-
204
-
205
-
206
-
207
-
208
-
209
-
210
-
211
-
212
-
213
-
214
-
215
-
216
-
217
-
218
-
219
-
220
-
221
-
222
-
223
-
224
-
225
-
226
-
227
-
228
-
229
-
230
-
231
-
232
-
233
-
234
-
235
-
236
-
237
-
238
-
239
-
240
-
241
-
242
-
243
-
244
-
245
-
246
-
247
-
248
-
249
-
250
-
251
-
252
-
253
-
254
-
255
-
256
-
257
-
258
-
259
-
260
-
261
-
262
 |
 |

49
RBS Group • Annual Report and Accounts 2006
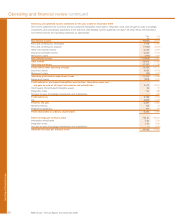
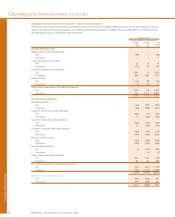
Operating and financial review
Financial highlights
2006 2005
for the year ended 31 December £m £m
Total income (1) 28,002 25,569
Profit before tax, purchased intangibles amortisation, integration costs and
net gain on sale of strategic investments and subsidiaries 9,414 8,251
Profit before tax 9,186 7,936
Profit attributable to ordinary shareholders 6,202 5,392
Cost:income ratio (2) 42.1% 42.4%
Basic earnings per share (pence) 194.7 169.4
Adjusted earnings per share (pence)(3) 200.0 175.9
Adjusted after-tax return on equity (4) 19.0% 18.2%
2006 2005
at 31 December £m £m
Total assets 871,432 776,827
Loans and advances to customers 466,893 417,226
Deposits 516,365 453,274
Shareholders’ equity 40,227 35,435
Risk asset ratio – tier 1 7.5% 7.6%
– total 11.7% 11.7%
Notes:
(1) Total income for the year ended 31 December 2005 excludes gains on sale of strategic investments and subsidiaries. In the statutory consolidated income statement on
page 139, these items are included in total income.
(2) Cost:income ratio represents operating expenses excluding purchased intangibles amortisation, integration costs and loss on sale of subsidiaries, expressed as a percentage of
total income excluding gain on sale of strategic investments and after netting operating lease depreciation against rental income.
(3) Adjusted earnings per share is based on earnings adjusted for purchased intangibles amortisation, integration costs and net gain on sale of strategic investments and
subsidiaries.
(4) Adjusted after-tax return on equity is based on profit attributable to ordinary shareholders adjusted for purchased intangibles amortisation, integration costs and net gain on sale
of strategic investments and subsidiaries, and average ordinary equity shareholders’ funds.