RBS 2006 Annual Report Download - page 97
Download and view the complete annual report
Please find page 97 of the 2006 RBS annual report below. You can navigate through the pages in the report by either clicking on the pages listed below, or by using the keyword search tool below to find specific information within the annual report.-
 1
1 -
2
-
3
-
4
-
5
-
6
-
7
-
8
-
9
-
10
-
11
-
12
-
13
-
14
-
15
-
16
-
17
-
18
-
19
-
20
-
21
-
22
-
23
-
24
-
25
-
26
-
27
-
28
-
29
-
30
-
31
-
32
-
33
-
34
-
35
-
36
-
37
-
38
-
39
-
40
-
41
-
42
-
43
-
44
-
45
-
46
-
47
-
48
-
49
-
50
-
51
-
52
-
53
-
54
-
55
-
56
-
57
-
58
-
59
-
60
-
61
-
62
-
63
-
64
-
65
-
66
-
67
-
68
-
69
-
70
-
71
-
72
-
73
-
74
-
75
-
76
-
77
-
78
-
79
-
80
-
81
-
82
-
83
-
84
-
85
-
86
-
 87
87 -
 88
88 -
 89
89 -
 90
90 -
 91
91 -
 92
92 -
 93
93 -
 94
94 -
 95
95 -
 96
96 -
 97
97 -
 98
98 -
 99
99 -
 100
100 -
 101
101 -
 102
102 -
 103
103 -
 104
104 -
 105
105 -
 106
106 -
 107
107 -
108
-
109
-
110
-
111
-
112
-
113
-
114
-
115
-
116
-
117
-
118
-
119
-
120
-
121
-
122
-
123
-
124
-
125
-
126
-
127
-
128
-
129
-
130
-
131
-
132
-
133
-
134
-
135
-
136
-
137
-
138
-
139
-
140
-
141
-
142
-
143
-
144
-
145
-
146
-
147
-
148
-
149
-
150
-
151
-
152
-
153
-
154
-
155
-
156
-
157
-
158
-
159
-
160
-
161
-
162
-
163
-
164
-
165
-
166
-
167
-
168
-
169
-
170
-
171
-
172
-
173
-
174
-
175
-
176
-
177
-
178
-
179
-
180
-
181
-
182
-
183
-
184
-
185
-
186
-
187
-
188
-
189
-
190
-
191
-
192
-
193
-
194
-
195
-
196
-
197
-
198
-
199
-
200
-
201
-
202
-
203
-
204
-
205
-
206
-
207
-
208
-
209
-
210
-
211
-
212
-
213
-
214
-
215
-
216
-
217
-
218
-
219
-
220
-
221
-
222
-
223
-
224
-
225
-
226
-
227
-
228
-
229
-
230
-
231
-
232
-
233
-
234
-
235
-
236
-
237
-
238
-
239
-
240
-
241
-
242
-
243
-
244
-
245
-
246
-
247
-
248
-
249
-
250
-
251
-
252
-
253
-
254
-
255
-
256
-
257
-
258
-
259
-
260
-
261
-
262
 |
 |

RBS Group • Annual Report and Accounts 2006
96
Operating and financial review continued
Operating and financial review
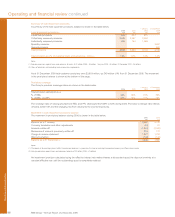
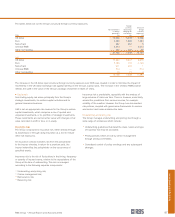
Percent increase/(decrease) in Citizens EVE
2% parallel upward 2% parallel downward
movement in movement in US interest rates
US interest rates (no negative rates allowed)
2006 % %
Period end (9.6) (7.2)
Maximum (10.1) (10.3)
Minimum (8.4) (1.9)
Average (9.4) (6.0)
2005
Period end (9.1) (8.2)
Maximum (10.1) (9.8)
Minimum (7.1) (4.4)
Average (9.2) (7.9)
For the Group, the other major structural interest rate risk arises
from a low interest rate environment, particularly in sterling,
sustained for a number of years. In such a scenario, deposit
pricing may reach effective floors below which it is not
practical to reduce rates further whilst variable rate asset
pricing continues to decline. A sustained low rate scenario
would also generate progressively reduced income from the
medium and long term hedging of non-interest bearing
liabilities. GALCO regularly reviews the impact of stress
scenarios including the impact of substantial declines in rates
to ensure that appropriate risk management strategies are
employed. Resulting action may involve execution of
derivatives, product development and tactical pricing changes.
Note 35 on the accounts includes, on pages 191 and 192,
tables that summarise the Group’s interest rate sensitivity gap
for its non-trading book at 31 December 2006 and 31 December
2005. The tables show the contractual re-pricing for each
category of asset, liability and for off-balance sheet items and
do not reflect the behaviouralised repricing used in the Group’s
asset and liability management methodology and the non-
trading interest rate VaR presented above.
●Currency risk
The Group does not maintain material non-trading open
currency positions other than the structural foreign currency
translation exposures arising from its investments in foreign
subsidiaries and associated undertakings and their related
currency funding. The Group’s policy in relation to structural
positions is to match fund the structural foreign currency
exposure arising from net asset value, including goodwill, in
foreign subsidiaries, equity accounted investments and
branches, except where doing so would materially increase the
sensitivity of either the Group’s or the subsidiary’s regulatory
capital ratios to currency movements. The policy requires
structural foreign exchange positions to be reviewed regularly
by GALCO. Foreign exchange differences arising on the
translation of foreign operations are recognised directly in
equity together with the effective portion of foreign exchange
differences arising on hedging liabilities.
The limits applied to these measures are set to parallel
movements of +/-1% and +/-2%. The EVE methodology
captures deposit re-pricing strategies and the embedded
option risks that exist within both the investment portfolio of
mortgage-backed securities and the consumer loan portfolio.
EVE is the present value of the cash flows generated by the
current balance sheet. EVE sensitivity to a 2% parallel
movement upwards and downwards in US interest rates is
shown below.