RBS 2006 Annual Report Download - page 205
Download and view the complete annual report
Please find page 205 of the 2006 RBS annual report below. You can navigate through the pages in the report by either clicking on the pages listed below, or by using the keyword search tool below to find specific information within the annual report.-
 1
1 -
2
-
3
-
4
-
5
-
6
-
7
-
8
-
9
-
10
-
11
-
12
-
13
-
14
-
15
-
16
-
17
-
18
-
19
-
20
-
21
-
22
-
23
-
24
-
25
-
26
-
27
-
28
-
29
-
30
-
31
-
32
-
33
-
34
-
35
-
36
-
37
-
38
-
39
-
40
-
41
-
42
-
43
-
44
-
45
-
46
-
47
-
48
-
49
-
50
-
51
-
52
-
53
-
54
-
55
-
56
-
57
-
58
-
59
-
60
-
61
-
62
-
63
-
64
-
65
-
66
-
67
-
68
-
69
-
70
-
71
-
72
-
73
-
74
-
75
-
76
-
77
-
78
-
79
-
80
-
81
-
82
-
83
-
84
-
85
-
86
-
87
-
88
-
89
-
90
-
91
-
92
-
93
-
94
-
95
-
96
-
97
-
98
-
99
-
100
-
101
-
102
-
103
-
104
-
105
-
106
-
107
-
108
-
109
-
110
-
111
-
112
-
113
-
114
-
115
-
116
-
117
-
118
-
119
-
120
-
121
-
122
-
123
-
124
-
125
-
126
-
127
-
128
-
129
-
130
-
131
-
132
-
133
-
134
-
135
-
136
-
137
-
138
-
139
-
140
-
141
-
142
-
143
-
144
-
145
-
146
-
147
-
148
-
149
-
150
-
151
-
152
-
153
-
154
-
155
-
156
-
157
-
158
-
159
-
160
-
161
-
162
-
163
-
164
-
165
-
166
-
167
-
168
-
169
-
170
-
171
-
172
-
173
-
174
-
175
-
176
-
177
-
178
-
179
-
180
-
181
-
182
-
183
-
184
-
185
-
186
-
187
-
188
-
189
-
190
-
191
-
192
-
193
-
194
-
 195
195 -
 196
196 -
 197
197 -
 198
198 -
 199
199 -
 200
200 -
 201
201 -
 202
202 -
 203
203 -
 204
204 -
 205
205 -
 206
206 -
 207
207 -
 208
208 -
 209
209 -
 210
210 -
 211
211 -
 212
212 -
 213
213 -
 214
214 -
 215
215 -
216
-
217
-
218
-
219
-
220
-
221
-
222
-
223
-
224
-
225
-
226
-
227
-
228
-
229
-
230
-
231
-
232
-
233
-
234
-
235
-
236
-
237
-
238
-
239
-
240
-
241
-
242
-
243
-
244
-
245
-
246
-
247
-
248
-
249
-
250
-
251
-
252
-
253
-
254
-
255
-
256
-
257
-
258
-
259
-
260
-
261
-
262
 |
 |

Financial statements
RBS Group • Annual Report and Accounts 2006
204
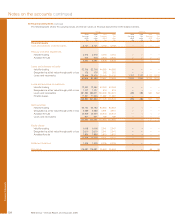
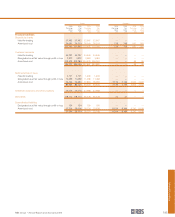
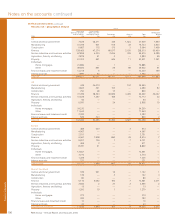
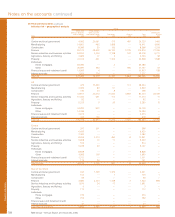
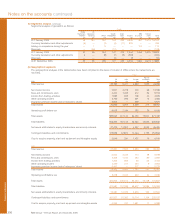
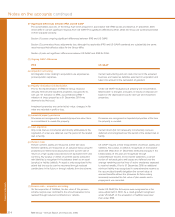
Notes on the accounts continued
Group
Operating
expenses
Net and Depreciation Allocation of Operating
interest Non-interest insurance and Impairment Manufacturing profit
income income Total claims amortisation losses Contribution costs before tax
2005 £m £m £m £m £m £m £m £m £m
Global Banking & Markets 1,034 4,557 5,591 (1,800) (473) (139) 3,179 (138) 3,041
UK Corporate Banking 1,904 1,265 3,169 (644) (343) (196) 1,986 (414) 1,572
Retail 4,068 3,374 7,442 (2,451) (38) (1,172) 3,781 (1,517) 2,264
Wealth Management 442 372 814 (377) (14) (13) 410 (138) 272
Ulster Bank 655 203 858 (246) (24) (58) 530 (207) 323
Citizens 2,122 1,142 3,264 (1,407) (151) (131) 1,575 — 1,575
RBS Insurance 461 5,028 5,489 (4,527) (27) — 935 (207) 728
Manufacturing (146) 51 (95) (2,140) (523) — (2,758) 2,758 —
Central items (622) (341) (963) (431) 5 2 (1,387) (137) (1,524)
9,918 15,651 25,569 (14,023) (1,588) (1,707) 8,251 — 8,251
Amortisation of intangibles ————(97) — (97) — (97)
Integration costs — — — (318) (140) — (458) — (458)
Net gain on sale of strategic
investments and subsidiaries — 333 333 (93) — — 240 — 240
9,918 15,984 25,902 (14,434) (1,825) (1,707) 7,936 — 7,936
2004
Global Banking & Markets 899 3,714 4,613 (1,496) (428) (311) 2,378 (128) 2,250
UK Corporate Banking 1,639 1,347 2,986 (586) (332) (270) 1,798 (383) 1,415
Retail 3,858 3,529 7,387 (2,568) (35) (702) 4,082 (1,402) 2,680
Wealth Management 403 370 773 (366) (30) (18) 359 (128) 231
Ulster Bank 550 193 743 (224) (27) (40) 452 (192) 260
Citizens 1,609 659 2,268 (1,003) (77) (117) 1,071 — 1,071
RBS Insurance 426 4,613 5,039 (4,135) (31) — 873 (192) 681
Manufacturing (102) 36 (66) (2,060) (426) — (2,552) 2,552 —
Central items (211) (141) (352) (243) 10 (27) (612) (127) (739)
9,071 14,320 23,391 (12,681) (1,376) (1,485) 7,849 — 7,849
Amortisation of intangibles ————(45) — (45) — (45)
Integration costs — — — (267) (253) — (520) — (520)
9,071 14,320 23,391 (12,948) (1,674) (1,485) 7,284 — 7,284
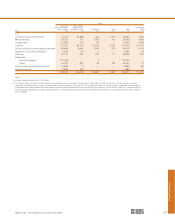
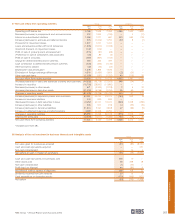
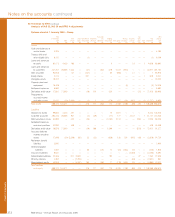
2006 2005 2004
Inter Inter Inter
External segment Total External segment Total External segment Total
Total revenue £m £m £m £m £m £m £m £m £m
Global Banking & Markets 11,414 7,638 19,052 8,474 3,623 12,097 6,718 3,370 10,088
UK Corporate Banking 5,957 18 5,975 6,104 101 6,205 5,039 637 5,676
Retail 11,334 1,612 12,946 10,880 1,516 12,396 10,441 1,392 11,833
Wealth Management 1,028 1,430 2,458 870 1,129 1,999 861 918 1,779
Ulster Bank 2,174 196 2,370 1,638 150 1,788 1,281 53 1,334
Citizens 5,872 2 5,874 4,878 4 4,882 2,929 15 2,944
RBS Insurance 6,365 82 6,447 6,194 67 6,261 6,043 33 6,076
Manufacturing 49 5 54 54 660421557
Central items 93 7,985 8,078 28 5,161 5,189 23 2,065 2,088
Eliminations — (18,968) (18,968) — (11,757) (11,757) — (8,498) (8,498)
44,286 — 44,286 39,120 — 39,120 33,377 — 33,377
Net gain on sale of strategic
investments — — — 333 — 333 — — —
44,286 — 44,286 39,453 — 39,453 33,377 — 33,377
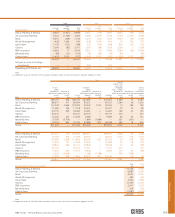
42 Segmental analysis (continued)