RBS 2006 Annual Report Download - page 200
Download and view the complete annual report
Please find page 200 of the 2006 RBS annual report below. You can navigate through the pages in the report by either clicking on the pages listed below, or by using the keyword search tool below to find specific information within the annual report.-
 1
1 -
2
-
3
-
4
-
5
-
6
-
7
-
8
-
9
-
10
-
11
-
12
-
13
-
14
-
15
-
16
-
17
-
18
-
19
-
20
-
21
-
22
-
23
-
24
-
25
-
26
-
27
-
28
-
29
-
30
-
31
-
32
-
33
-
34
-
35
-
36
-
37
-
38
-
39
-
40
-
41
-
42
-
43
-
44
-
45
-
46
-
47
-
48
-
49
-
50
-
51
-
52
-
53
-
54
-
55
-
56
-
57
-
58
-
59
-
60
-
61
-
62
-
63
-
64
-
65
-
66
-
67
-
68
-
69
-
70
-
71
-
72
-
73
-
74
-
75
-
76
-
77
-
78
-
79
-
80
-
81
-
82
-
83
-
84
-
85
-
86
-
87
-
88
-
89
-
90
-
91
-
92
-
93
-
94
-
95
-
96
-
97
-
98
-
99
-
100
-
101
-
102
-
103
-
104
-
105
-
106
-
107
-
108
-
109
-
110
-
111
-
112
-
113
-
114
-
115
-
116
-
117
-
118
-
119
-
120
-
121
-
122
-
123
-
124
-
125
-
126
-
127
-
128
-
129
-
130
-
131
-
132
-
133
-
134
-
135
-
136
-
137
-
138
-
139
-
140
-
141
-
142
-
143
-
144
-
145
-
146
-
147
-
148
-
149
-
150
-
151
-
152
-
153
-
154
-
155
-
156
-
157
-
158
-
159
-
160
-
161
-
162
-
163
-
164
-
165
-
166
-
167
-
168
-
169
-
170
-
171
-
172
-
173
-
174
-
175
-
176
-
177
-
178
-
179
-
180
-
181
-
182
-
183
-
184
-
185
-
186
-
187
-
188
-
189
-
 190
190 -
 191
191 -
 192
192 -
 193
193 -
 194
194 -
 195
195 -
 196
196 -
 197
197 -
 198
198 -
 199
199 -
 200
200 -
 201
201 -
 202
202 -
 203
203 -
 204
204 -
 205
205 -
 206
206 -
 207
207 -
 208
208 -
 209
209 -
 210
210 -
211
-
212
-
213
-
214
-
215
-
216
-
217
-
218
-
219
-
220
-
221
-
222
-
223
-
224
-
225
-
226
-
227
-
228
-
229
-
230
-
231
-
232
-
233
-
234
-
235
-
236
-
237
-
238
-
239
-
240
-
241
-
242
-
243
-
244
-
245
-
246
-
247
-
248
-
249
-
250
-
251
-
252
-
253
-
254
-
255
-
256
-
257
-
258
-
259
-
260
-
261
-
262
 |
 |
RBS Group • Annual Report and Accounts 2006 199
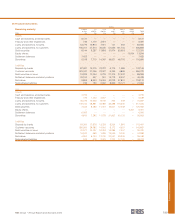
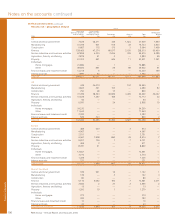
Financial statements
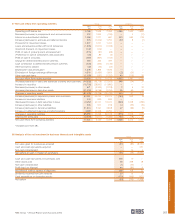
Group
Loans and Treasury bills,
advances to banks debt securities Netting and
and customers and equity shares Derivatives Other (1) Total offset (2)
2005 £m £m £m £m £m £m
Total
Central and local government 5,094 49,491 1,554 519 56,658 1,481
Manufacturing 24,761 551 1,186 — 26,498 3,647
Construction 11,566 83 134 — 11,783 1,224
Finance 144,873 78,651 89,333 5,958 318,815 100,161
Service industries and business activities 75,462 4,099 2,289 162 82,012 5,222
Agriculture, forestry and fishing 3,294 17 2 — 3,313 58
Property 51,479 455 1,162 — 53,096 1,584
Individuals
Home mortgages 109,133 922 3 — 110,058 —
Other 45,760 669 — 186 46,615 53
Finance lease and instalment credit 18,193 4 — — 18,197 158
Interest accruals 2,085 994 — — 3,079 2
491,700 135,936 95,663 6,825 730,124 113,590
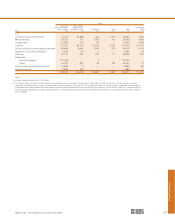
Notes:
(1) Includes settlement balances of £6,005 million.
(2) This column shows the amount by which exposures to counterparties are reduced by the existence of a legal right of set-off (on the basis that the financial asset will be
collected in accordance with its terms) and under master netting arrangements. The credit risk of financial assets subject to a master netting arrangement is eliminated only
to the extent that financial liabilities due to the same counterparty will be settled after the assets are realised. The extent to which the Group's credit risk is reduced through a
master netting arrangement may change substantially within a short period following the balance sheet date because the exposure is affected by each transaction subject to
the arrangement.
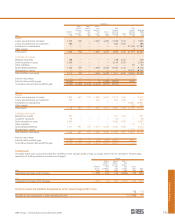
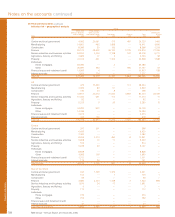
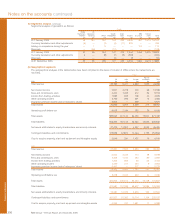
36 Memorandum items
Contingent liabilities and commitments
The amounts shown in the table below are intended only to provide an indication of the volume of business outstanding at
31 December. Although the Group is exposed to credit risk in the event of non-performance of the obligations undertaken by
customers, the amounts shown do not, and are not intended to, provide any indication of the Group’s expectation of future losses.
Group Company
2006 2005 2006 2005
£m £m £m £m
Contingent liabilities:
Guarantees and assets pledged as collateral security 13,013 12,253 397 448
Other contingent liabilities 6,833 6,394 ——
19,846 18,647 397 448
Commitments:
Undrawn formal standby facilities, credit lines and other commitments to lend
– less than one year 133,673 121,911 ——
– one year and over 101,913 81,110 ——
Other commitments 2,402 3,529 ——
237,988 206,550 ——