RBS 2006 Annual Report Download - page 168
Download and view the complete annual report
Please find page 168 of the 2006 RBS annual report below. You can navigate through the pages in the report by either clicking on the pages listed below, or by using the keyword search tool below to find specific information within the annual report.-
 1
1 -
2
-
3
-
4
-
5
-
6
-
7
-
8
-
9
-
10
-
11
-
12
-
13
-
14
-
15
-
16
-
17
-
18
-
19
-
20
-
21
-
22
-
23
-
24
-
25
-
26
-
27
-
28
-
29
-
30
-
31
-
32
-
33
-
34
-
35
-
36
-
37
-
38
-
39
-
40
-
41
-
42
-
43
-
44
-
45
-
46
-
47
-
48
-
49
-
50
-
51
-
52
-
53
-
54
-
55
-
56
-
57
-
58
-
59
-
60
-
61
-
62
-
63
-
64
-
65
-
66
-
67
-
68
-
69
-
70
-
71
-
72
-
73
-
74
-
75
-
76
-
77
-
78
-
79
-
80
-
81
-
82
-
83
-
84
-
85
-
86
-
87
-
88
-
89
-
90
-
91
-
92
-
93
-
94
-
95
-
96
-
97
-
98
-
99
-
100
-
101
-
102
-
103
-
104
-
105
-
106
-
107
-
108
-
109
-
110
-
111
-
112
-
113
-
114
-
115
-
116
-
117
-
118
-
119
-
120
-
121
-
122
-
123
-
124
-
125
-
126
-
127
-
128
-
129
-
130
-
131
-
132
-
133
-
134
-
135
-
136
-
137
-
138
-
139
-
140
-
141
-
142
-
143
-
144
-
145
-
146
-
147
-
148
-
149
-
150
-
151
-
152
-
153
-
154
-
155
-
156
-
157
-
 158
158 -
 159
159 -
 160
160 -
 161
161 -
 162
162 -
 163
163 -
 164
164 -
 165
165 -
 166
166 -
 167
167 -
 168
168 -
 169
169 -
 170
170 -
 171
171 -
 172
172 -
 173
173 -
 174
174 -
 175
175 -
 176
176 -
 177
177 -
 178
178 -
179
-
180
-
181
-
182
-
183
-
184
-
185
-
186
-
187
-
188
-
189
-
190
-
191
-
192
-
193
-
194
-
195
-
196
-
197
-
198
-
199
-
200
-
201
-
202
-
203
-
204
-
205
-
206
-
207
-
208
-
209
-
210
-
211
-
212
-
213
-
214
-
215
-
216
-
217
-
218
-
219
-
220
-
221
-
222
-
223
-
224
-
225
-
226
-
227
-
228
-
229
-
230
-
231
-
232
-
233
-
234
-
235
-
236
-
237
-
238
-
239
-
240
-
241
-
242
-
243
-
244
-
245
-
246
-
247
-
248
-
249
-
250
-
251
-
252
-
253
-
254
-
255
-
256
-
257
-
258
-
259
-
260
-
261
-
262
 |
 |
167
RBS Group • Annual Report and Accounts 2006
Financial statements
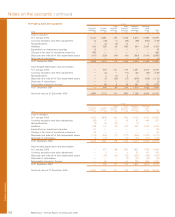
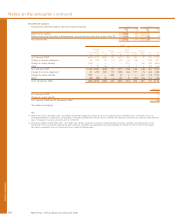
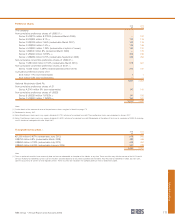
28 Subordinated liabilities
Group Company
2006 2005 2006 2005
£m £m £m £m
Designated as at fair value through profit or loss 124 150 ——
Amortised cost 27,530 28,124 8,194 9,242
27,654 28,274 8,194 9,242
Group Company
2006 2005 2006 2005
£m £m £m £m
Dated loan capital 13,772 13,001 5,531 5,635
Undated loan capital 9,555 10,132 834 1,244
Preference shares 2,277 2,840 1,829 2,363
Trust preferred securities 2,050 2,301 ——
27,654 28,274 8,194 9,242
Certain preference shares are classified as liabilities; these securities remain subject to the capital maintenance rules of the
Companies Act 1985.
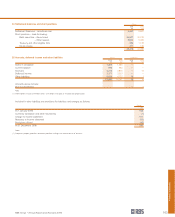
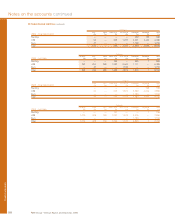
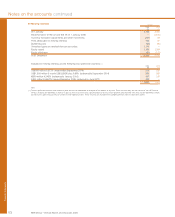
The following tables analyse the remaining maturity of subordinated liabilities by (1) the final redemption date; and (2) the next
callable date.
Group
2007 2008 2009-2011 2012-2016 Thereafter Perpetual Total
2006 – final redemption £m £m £m £m £m £m £m
Sterling 352 — — 772 391 5,960 7,475
US$ 112 87 1,123 3,938 229 4,893 10,382
Euro 187 173 955 2,656 1,578 2,381 7,930
Other 24 — — 984 445 414 1,867
Total 675 260 2,078 8,350 2,643 13,648 27,654
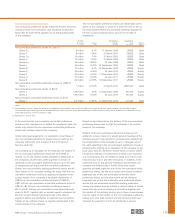
Group
Currently 2007 2008 2009– 2011 2012– 2016 Thereafter Perpetual Total
2006 – call date £m £m £m £m £m £m £m £m
Sterling — 502 — 1,103 2,161 3,543 166 7,475
US$ 1,843 1,200 469 3,835 1,859 1,176 — 10,382
Euro — 274 948 1,634 4,473 565 36 7,930
Other — 24 — 701 1,043 99 — 1,867
Total 1,843 2,000 1,417 7,273 9,536 5,383 202 27,654
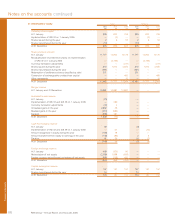
Group
2006 2007 2008-2010 2011-2015 Thereafter Perpetual Total
2005 – final redemption £m £m £m £m £m £m £m
Sterling 51 150 — 1,123 415 6,083 7,822
US$ 412 — 811 3,537 555 6,552 11,867
Euro 129 — 836 3,003 1,164 2,539 7,671
Other 10 — 356 425 — 123 914
Total 602 150 2,003 8,088 2,134 15,297 28,274
Group
Currently 2006 2007 2008 – 2010 2011– 2015 Thereafter Perpetual Total
2005 – call date £m £m £m £m £m £m £m £m
Sterling 139 331 324 761 1,188 4,913 166 7,822
US$ 2,386 878 622 2,637 3,079 2,265 — 11,867
Euro — 148 — 1,997 2,659 2,830 37 7,671
Other — 10 — 781 — 123 — 914
Total 2,525 1,367 946 6,176 6,926 10,131 203 28,274