RBS 2006 Annual Report Download - page 237
Download and view the complete annual report
Please find page 237 of the 2006 RBS annual report below. You can navigate through the pages in the report by either clicking on the pages listed below, or by using the keyword search tool below to find specific information within the annual report.-
 1
1 -
2
-
3
-
4
-
5
-
6
-
7
-
8
-
9
-
10
-
11
-
12
-
13
-
14
-
15
-
16
-
17
-
18
-
19
-
20
-
21
-
22
-
23
-
24
-
25
-
26
-
27
-
28
-
29
-
30
-
31
-
32
-
33
-
34
-
35
-
36
-
37
-
38
-
39
-
40
-
41
-
42
-
43
-
44
-
45
-
46
-
47
-
48
-
49
-
50
-
51
-
52
-
53
-
54
-
55
-
56
-
57
-
58
-
59
-
60
-
61
-
62
-
63
-
64
-
65
-
66
-
67
-
68
-
69
-
70
-
71
-
72
-
73
-
74
-
75
-
76
-
77
-
78
-
79
-
80
-
81
-
82
-
83
-
84
-
85
-
86
-
87
-
88
-
89
-
90
-
91
-
92
-
93
-
94
-
95
-
96
-
97
-
98
-
99
-
100
-
101
-
102
-
103
-
104
-
105
-
106
-
107
-
108
-
109
-
110
-
111
-
112
-
113
-
114
-
115
-
116
-
117
-
118
-
119
-
120
-
121
-
122
-
123
-
124
-
125
-
126
-
127
-
128
-
129
-
130
-
131
-
132
-
133
-
134
-
135
-
136
-
137
-
138
-
139
-
140
-
141
-
142
-
143
-
144
-
145
-
146
-
147
-
148
-
149
-
150
-
151
-
152
-
153
-
154
-
155
-
156
-
157
-
158
-
159
-
160
-
161
-
162
-
163
-
164
-
165
-
166
-
167
-
168
-
169
-
170
-
171
-
172
-
173
-
174
-
175
-
176
-
177
-
178
-
179
-
180
-
181
-
182
-
183
-
184
-
185
-
186
-
187
-
188
-
189
-
190
-
191
-
192
-
193
-
194
-
195
-
196
-
197
-
198
-
199
-
200
-
201
-
202
-
203
-
204
-
205
-
206
-
207
-
208
-
209
-
210
-
211
-
212
-
213
-
214
-
215
-
216
-
217
-
218
-
219
-
220
-
221
-
222
-
223
-
224
-
225
-
226
-
 227
227 -
 228
228 -
 229
229 -
 230
230 -
 231
231 -
 232
232 -
 233
233 -
 234
234 -
 235
235 -
 236
236 -
 237
237 -
 238
238 -
 239
239 -
 240
240 -
 241
241 -
 242
242 -
 243
243 -
 244
244 -
 245
245 -
 246
246 -
 247
247 -
248
-
249
-
250
-
251
-
252
-
253
-
254
-
255
-
256
-
257
-
258
-
259
-
260
-
261
-
262
 |
 |

RBS Group • Annual Report and Accounts 2006
236
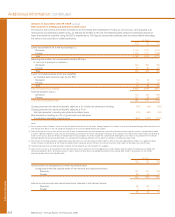
Additional information continued
Additional information
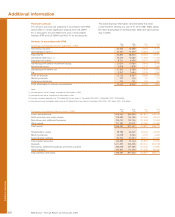
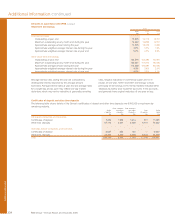
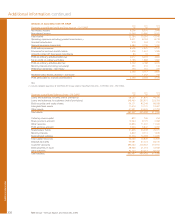
Amounts in accordance with UK GAAP
2004 2003 2002
Summary consolidated profit and loss account – UK GAAP £m £m £m
Net interest income 9,208 8,301 7,849
Non-interest income 13,546 10,980 9,167
Total income 22,754 19,281 17,016
Operating expenses excluding goodwill amortisation (1) 9,931 8,753 8,738
Goodwill amortisation 915 763 731
General insurance claims (net) 3,480 2,195 1,350
Profit before provisions 8,428 7,570 6,197
Provisions for bad and doubtful debts 1,428 1,461 1,286
Amounts written off fixed asset investments 83 33 59
Profit on ordinary activities before tax 6,917 6,076 4,852
Tax on profit on ordinary activities 2,155 1,888 1,582
Profit on ordinary activities after tax 4,762 4,188 3,270
Minority interests (including non-equity) 250 210 133
Preference dividends – non-equity 256 261 305
4,256 3,717 2,832
Additional Value Shares dividend – non-equity — 1,463 798
Profit attributable to ordinary shareholders 4,256 2,254 2,034
Note:
(1) Includes integration expenditure of £269 million for the year ended 31 December 2004 (2003 – £229 million; 2002 – £957 million).
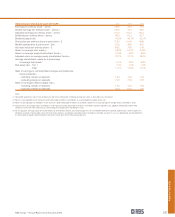
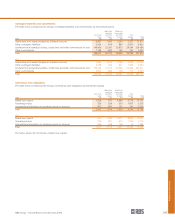
2004 2003 2002
Summary consolidated balance sheet – UK GAAP £m £m £m
Loans and advances to banks (net of provisions) 58,260 51,891 44,296
Loans and advances to customers (net of provisions) 345,469 252,531 223,324
Debt securities and equity shares 94,171 82,249 68,928
Intangible fixed assets 17,576 13,131 12,697
Other assets 67,991 54,626 61,793
Total assets 583,467 454,428 411,038
Called up share capital 822 769 754
Share premium account 12,964 8,175 7,608
Other reserves 10,856 11,307 11,922
Profit and loss account 7,223 5,847 4,787
Shareholders’ funds 31,865 26,098 25,071
Minority interests 3,829 2,713 1,839
Subordinated liabilities 20,366 16,998 13,965
Total capital resources 56,060 45,809 40,875
Deposits by banks 99,081 67,323 54,720
Customer accounts 285,062 236,963 219,161
Debt securities in issue 58,960 41,016 33,938
Other liabilities 84,304 63,317 62,344
Total liabilities 583,467 454,428 411,038